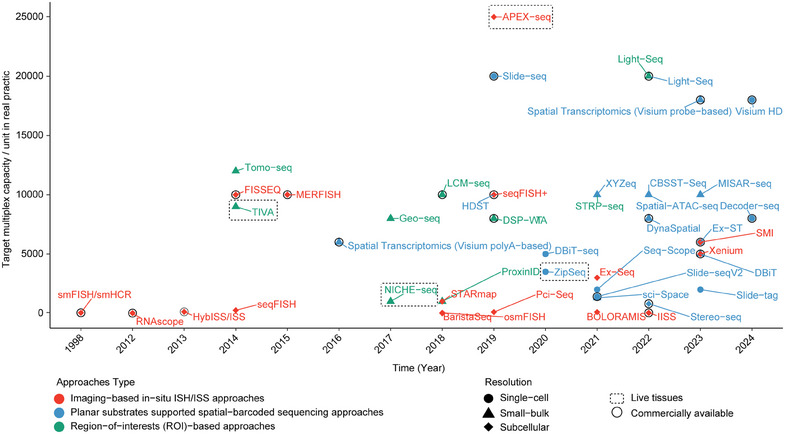
FIGURE 1.

The development roadmap of spatial transcriptomics (ST). Individual ST technologies are presented in a timeline graph between 1998 and 2024 (current). Colors annotate different categories based on their analytical principles including imaging‐based in situ ISH/ISS (red) and planar substrates supported spatial‐barcoded sequencing (blue). From application perspective, other regions‐of‐interest (ROI) based technologies (light‐guided and image‐free) are grouped in green color. Spatial resolutions are presented in different shapes (triangle: small bulk, circle: single‐cell, diamond: subcellular). Black circles indicate technologies that are commercially available. Dashed rectangles indicate application scenario (live tissues). Horizontal axis shows the multiplexity of technologies. Note: data summarized may not include all relevant technologies and target plexity is a rough estimate based on references.
