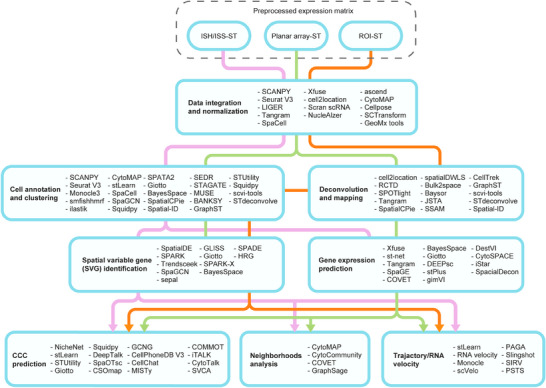
FIGURE 2.

The spatial transcriptome data analysis toolbox. Graphical demonstration of typical ST data analysis pipeline based on three mainstream technical or strategical grounds (ISH/ISS‐ST, planar array‐ST, and ROI‐ST). Workflows start with preprocessed expression matrix and three different colored lines (light blue, pale green and orange) depict data analysis normally involved for three ST outputs respectively. The workflow directions are based on stepwise analysis approaches and each box represents a domain of spatial profiling methodology. Notes: The analysis toolbox is summarized based on literature searches and may not include all available methods. ISH, in‐site hybridization; ISS, in situ sequencing; ROI, region‐of‐interest.
