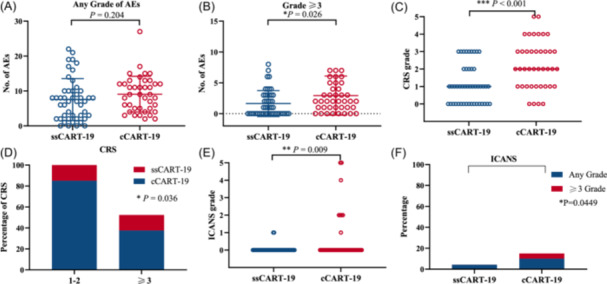
Figure 2.

AEs, CRS, and ICANS in patients with 28 days after CAR T‐cell infusion. (A) Number of AEs at any grade for ssCART‐19 and cCART‐19 groups (p = 0.204; t test). (B) Number of grade ≥3 AEs in the ssCART‐19 group and cCART‐19 group (p = 0.026; t test). (C) Number of CRS at any grade for ssCART‐19 and cCART‐19 groups (p < 0.001; Mann–Whitney nonparametric test). (D) Percentage of different grades of CRS for ssCART‐19 and cCART‐19 groups (p = 0.036; Fisher's exact test). (E) Grade of ICANS for ssCART‐19 and cCART‐19 groups (p = 0.009; Mann–Whitney nonparametric test). Percentage of different grades of ICANS for ssCART‐19 and cCART‐19 groups (p = 0.049; Fisher's exact test). (F) Percentage of different grades of ICANS for ssCART‐19 groups and cCART‐19 groups (p = 0.0449; Fisher's exact test).
