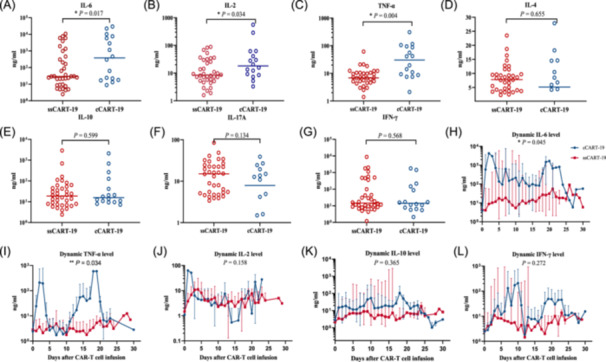
Figure 3.

Cytokine levels in the two groups. (A–G) Scatter plots of the peak concentration of interleukin 6 (IL‐6), IL‐2, tumor necrosis factor‐α (TNF‐α), IL‐4, IL‐10, IL‐17A, and IFN‐γ. (H–L) Dynamic changes in the cytokines IL‐6, TNF‐α, IL‐2, IL‐10, and IFN‐γ within 28 days after CAR T‐cell infusion.
