. 2024 Oct 7;8(10):e70007. doi: 10.1002/hem3.70007
© 2024 The Author(s). HemaSphere published by John Wiley & Sons Ltd on behalf of European Hematology Association.
This is an open access article under the terms of the http://creativecommons.org/licenses/by-nc-nd/4.0/ License, which permits use and distribution in any medium, provided the original work is properly cited, the use is non‐commercial and no modifications or adaptations are made.
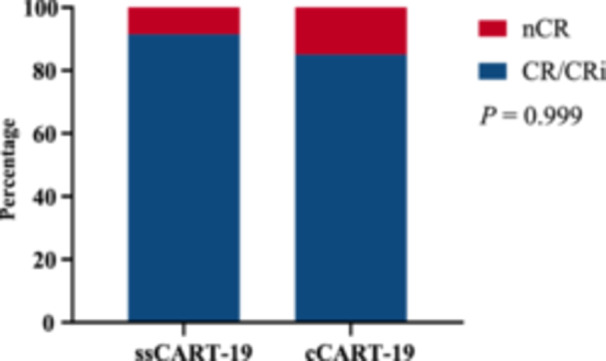
Figure 4.

Response rates in the two groups (p = 0.999; t test).
