Figure 6.

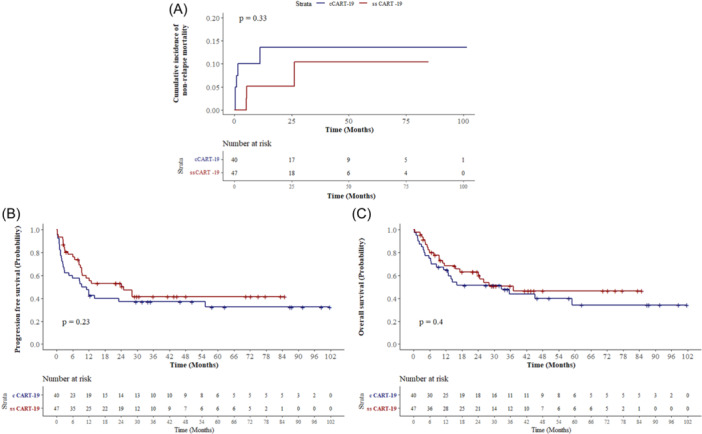
Response and survival. (A) NRM of the two groups of patients. (B, C) Kaplan–Meier curves of progression‐free survival and overall survival.

Response and survival. (A) NRM of the two groups of patients. (B, C) Kaplan–Meier curves of progression‐free survival and overall survival.