
Figure 7.
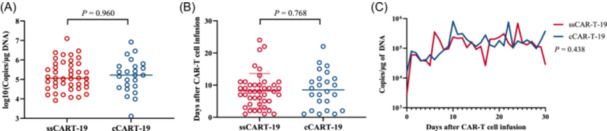
Expansion of CAR T‐cells. (A) C max in the ssCART‐19 and cCART‐19 groups (p = 0.960). (B) T max in the ssCART‐19 and cCART‐19 groups (p = 0.768). (C) Dynamic expansion of CAR T‐cells within 30 days postinfusion. The results showed no difference in the copies of CAR T‐cells in the ssCART‐19 and cCART‐19 groups (p = 0.438).