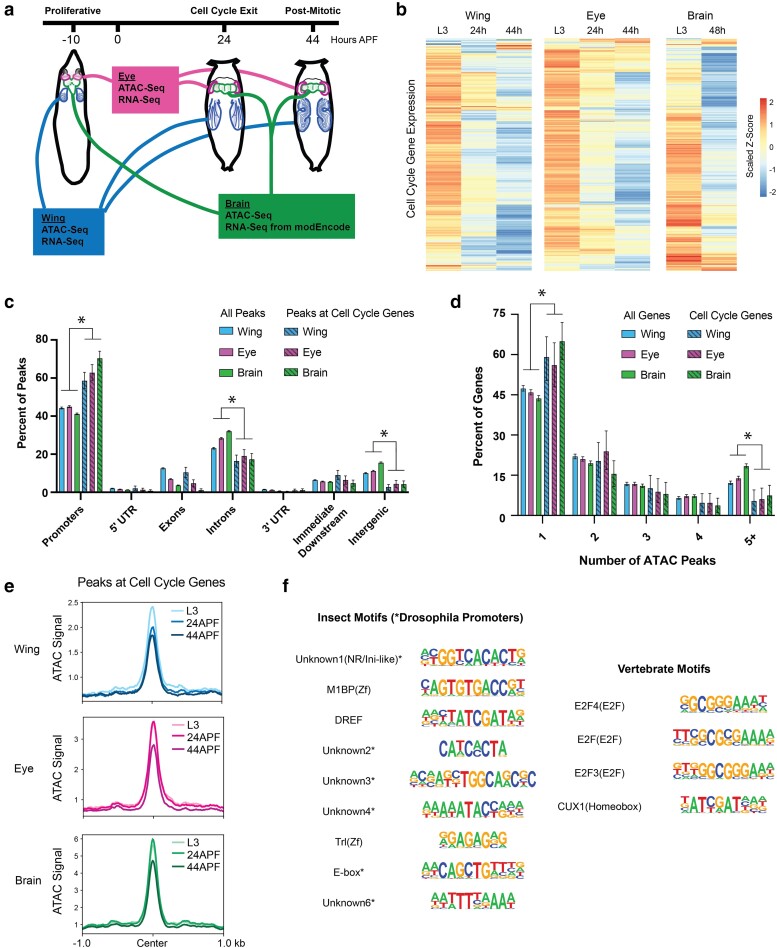
Fig. 2.
Most cell cycle genes have simpler than average regulatory architectures, are transcriptionally repressed after cell cycle exit, but retain chromatin accessibility in terminally differentiating fly tissues. a) Wing, eye, and brain tissue were dissected from wandering third instar larvae (L3, ∼10 h prior to puparium formation) and from pupae at 24 h or 44 h after puparium formation (APF). ATAC-Seq and RNA-Seq datasets were generated from wing and eye tissues at all 3 timepoints. ATAC-Seq data were generated from brain tissue at all 3 timepoints. Publicly available RNA-Seq datasets from L3 larval brain and 2-day pupa brain were generated by modEncode. b) Heatmap depicting the average RNA-Seq transcript expression values for 284 genes with annotated functions related to the cell cycle. Data are scaled by Z-score and hierarchically clustered. c) Bar plot showing the genomic distributions of ATAC-Seq peaks from the wing, eye, and brain, either for all peaks genome-wide (open bars; wing, eye, and brain datasets contain 21,061, 23,189, and 28,478 peaks, respectively) or only peaks assigned to cell cycle genes (striped bars; wing, eye, and brain datasets contain 285, 293, and 351 peaks respectively). Error bars depict the 95% confidence interval computed from non-parametric bootstrapping analysis with 1,000 replications; asterisks mark comparisons with non-overlapping confidence intervals. d) Bar plot showing the distributions of genes binned by the number of ATAC-Seq peaks annotated to the gene. Data are shown from the wing, eye, and brain, for either all genes (open bars; wing, eye, and brain datasets contain 8,677, 9,065, and 9,635 genes, respectively) or cell cycle genes (striped bars; wing, eye, and brain datasets contain 147, 146, and 186 genes, respectively). Error bars depict the 95% confidence interval computed from non-parametric bootstrapping analysis with 1,000 replications; asterisks mark comparisons with non-overlapping confidence intervals. e) Line plots showing the average ATAC-Seq signal across tissues and time points at peaks associated with cell cycle genes (±1 kb from peak center). f) Summary of motif enrichment analyses on peaks associated with cell cycle genes in each tissue, including motifs annotated in insects and vertebrates. Full motif enrichment data are available in Supplementary Table 2. The table includes motif name and class and position weight matrix (PWM). Each motif received a Benjamini-corrected q-value < 0.05 for at least one tissue.

