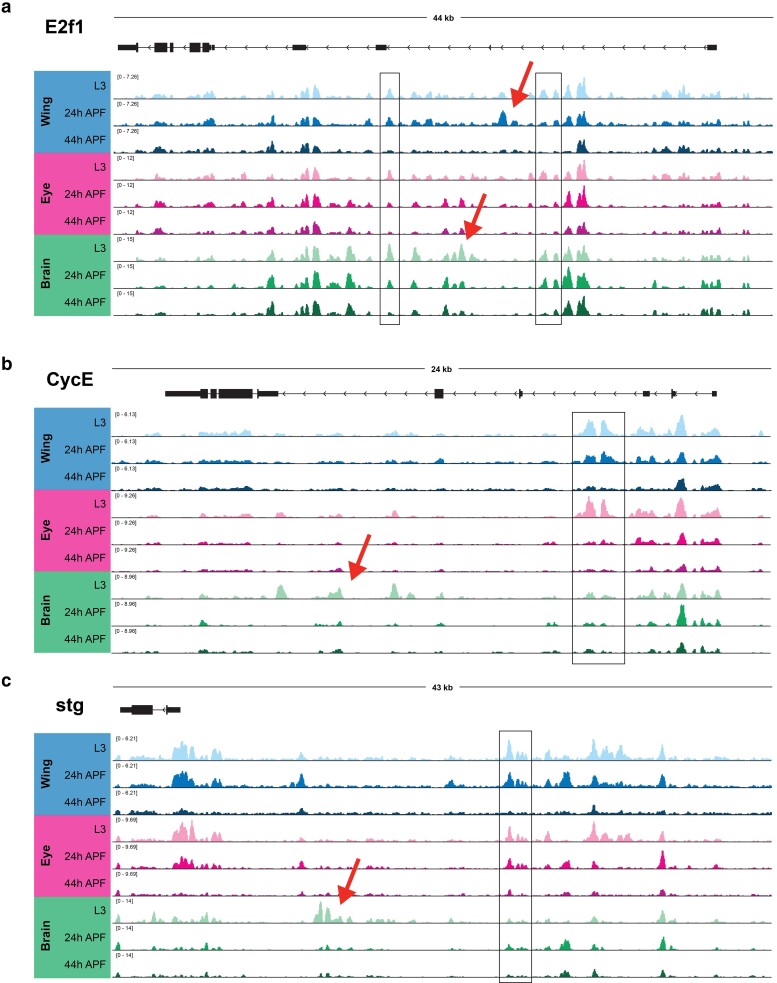
Fig. 4.
Long-lived postmitotic fly tissues decommission enhancers at select, rate-limiting cell cycle genes. ATAC-Seq accessibility data at (a) e2f1, (b) cycE, and (c) stg gene loci across tissues and time points. Arrows on gene diagrams indicate the direction of transcription. Y-axes indicate the normalized read counts per million. Boxes highlight example regions of shared accessibility across 2 or more tissues. Arrows highlight example regions of tissue-specific accessibility.

