Fig. 6.
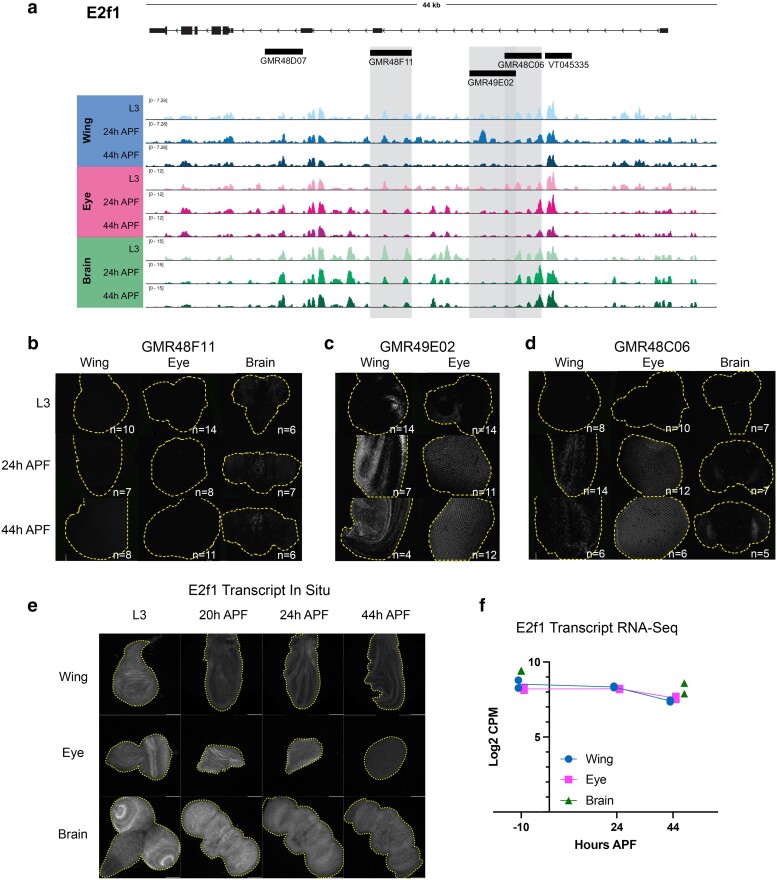
Dynamic chromatin regions within e2f1 show enhancer activity in vivo. a) ATAC-seq accessibility data at the e2f1 locus across tissues and timepoints. Fragments used to direct Gal4 expression in publicly available driver lines are depicted by black bars, each of which was tested for enhancer activity. b–d) Enhancer expression data are presented for driver lines GMR48F11, GMR49E02, and GMR48C06, which are highlighted by gray boxes in (a). Each driver was tested in wing, eye, and/or brain at L3, 24 h APF and 44 h APF time points. Grayscale images show the readout of “current” Gal4 activity (UAS-RFP) and signal intensities are qualitative to emphasize the distinct spatial domains of activity across driver lines. Comprehensive data from all drivers is available in Supplementary Figs. 2–4. e) HCR-FISH data showing e2f1 transcript expression in wing, eye, and brain at L3, 20, 24, and 44 h APF. f) Line plot showing e2f1 Log2-transformed counts per million (CPM) expression levels via RNA-Seq in wing and eye at L3, 24 and 44 h APF timepoints, and in brain at L3 and 48 h APF timepoints. Individual data points represent values from RNA-Seq replicates.

