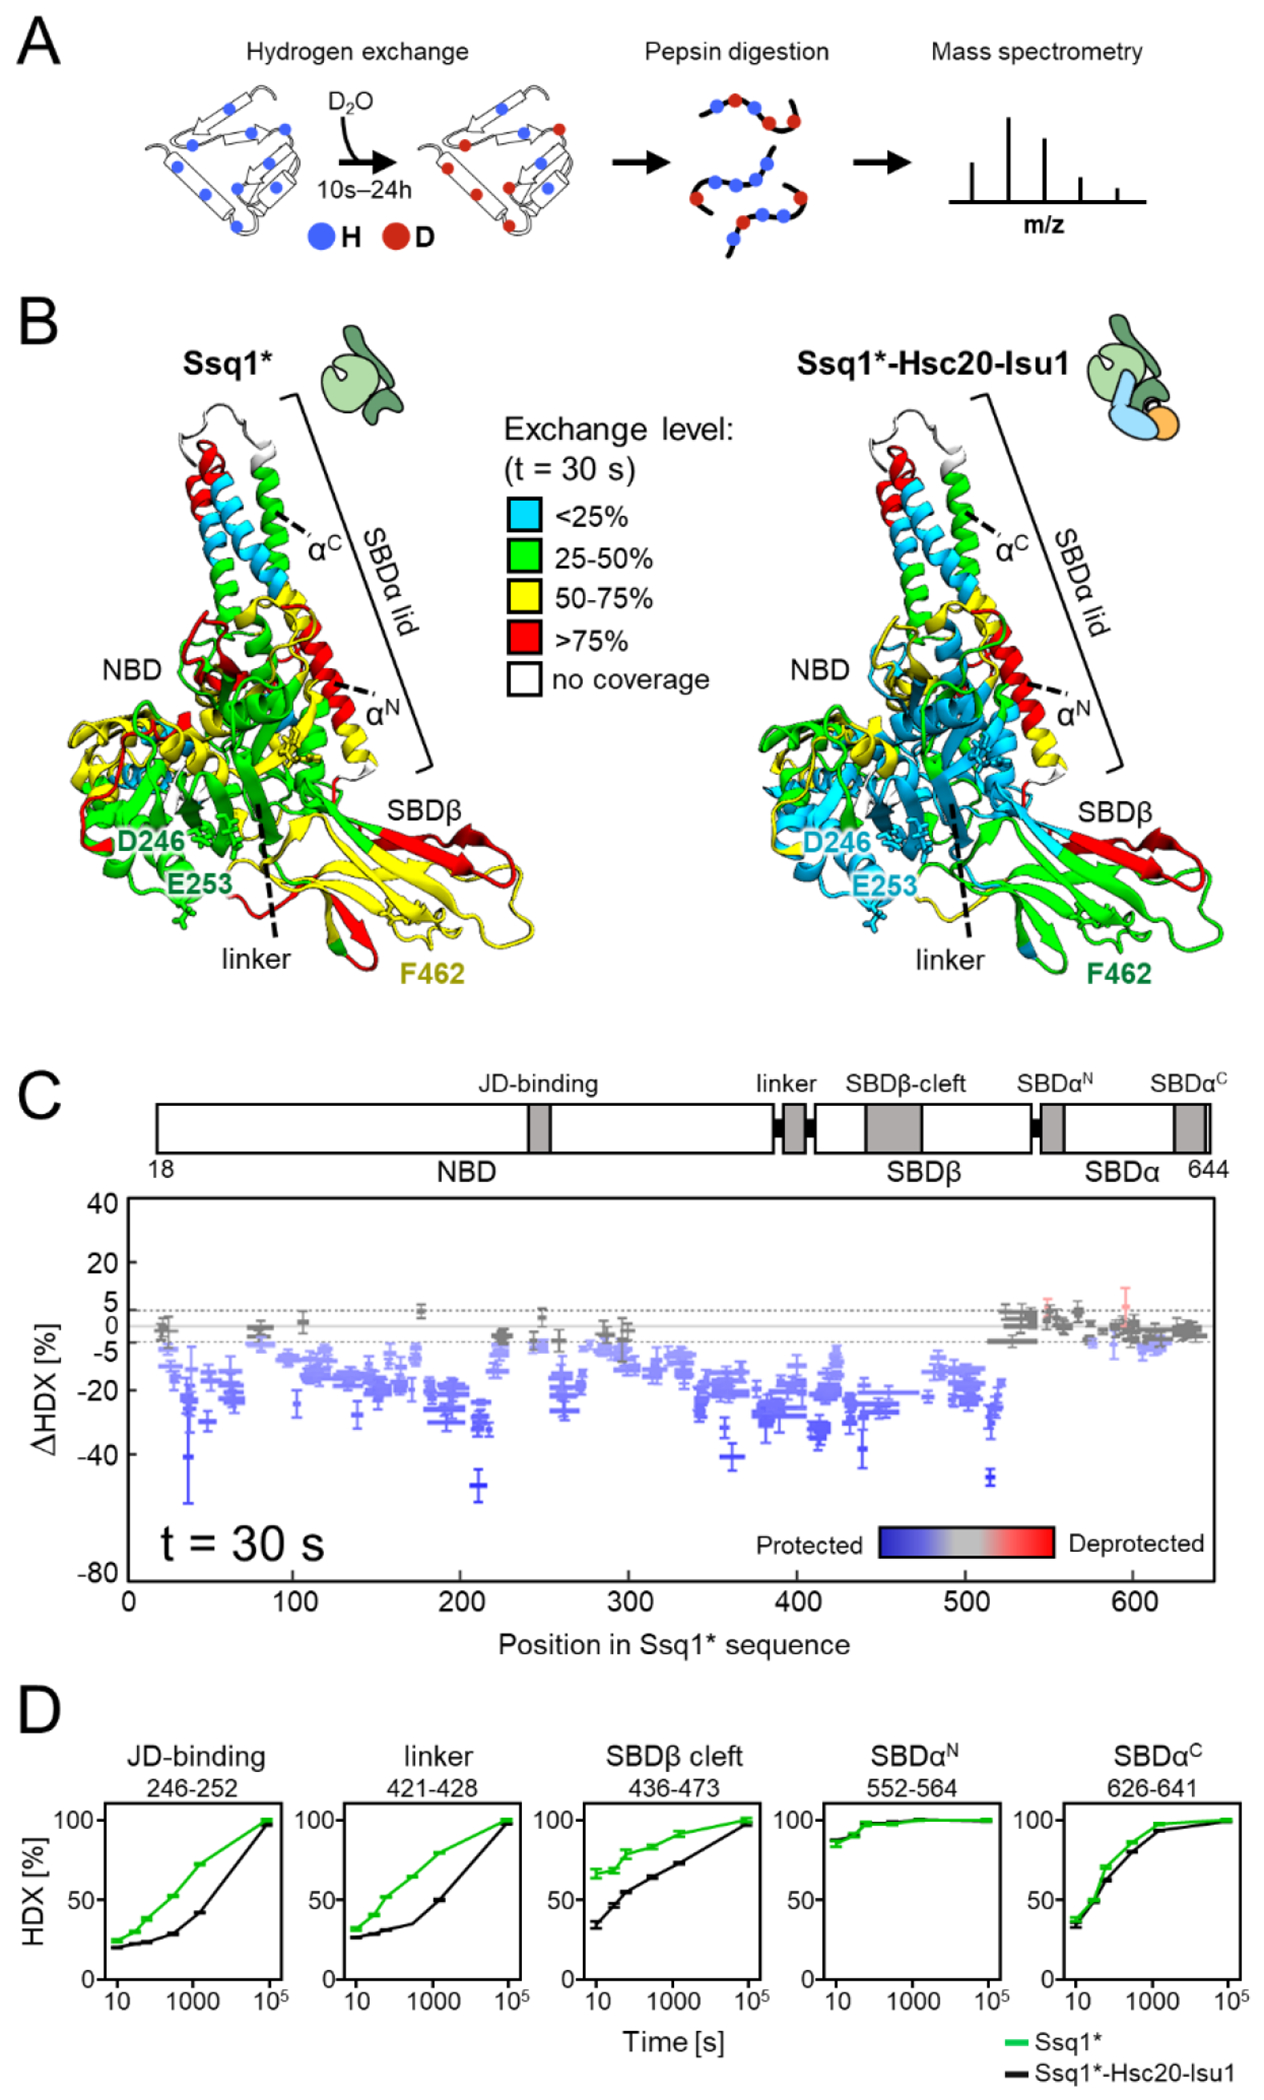
Figure 3. HDX-MS analysis of Ssq1 alone and in the tripartite Ssq1*-Hsc20-Isu1 complex.

(A) Scheme of HDX-MS experiment. Proteins, alone or in complexes, were incubated in D2O buffer allowing deuterium incorporation into the polypeptide backbone. After quenching exchange at a number of points in time and subsequent proteolysis, peptides were subjected to MS analysis to determine the increase in mass resulting from deuterium uptake.
(B-C) Deuterium uptake of Ssq1* alone and in the tripartite Ssq1*-Hsc20-Isu1 complex. Data shown are for 30 s exchange time point. (B) Relative fractional deuterium uptake mapped on the structural model of Ssq1*(ATP). Nucleotide binding domain (NBD), substrate binding subdomains (SBDβ, having substrate binding cleft; SBDα “lid”), interdomain linker (linker); N-terminal (αN) and C-terminal (αC) lid helices. D246, E253 – residues of the NBD interacting with Hsc20; F462 residue of the substrate binding cleft of SBDβ interacting with LPPVK of Isu1. (C) Difference in deuterium uptake between Ssq1* alone and in the tripartite complex. Horizontal lines indicate peptides observed; differences in deuterium uptake colored – blue (retarded), red (accelerated). Error bars represent uncertainty in difference in deuterium uptake for a given peptide. (D) Kinetics of relative deuterium uptake into selected peptides of Ssq1* alone (green), tripartite complex (black).
