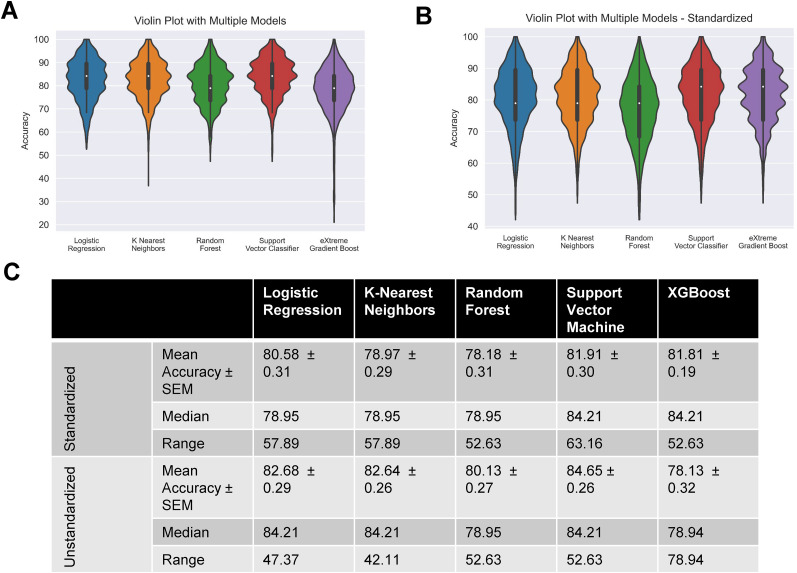
Figure 6.
Performance of chosen models across randomized train–test splits. Performances of logistic regression, k-nearest neighbors, random forest, and linear support vector machine on Monte Carlo simulation (1,000 randomly created 80-20 train–test splits) were compared with violin plots of model accuracy when trained and tested on standardized/unstandardized dataset, hue represents model, plot is cut to represent the range of accuracies, and interior box and whisker plot show quartiles and median. A, Unstandardized dataset. B, Standardized dataset. C, Table showing performance metrics of both groups of models.

