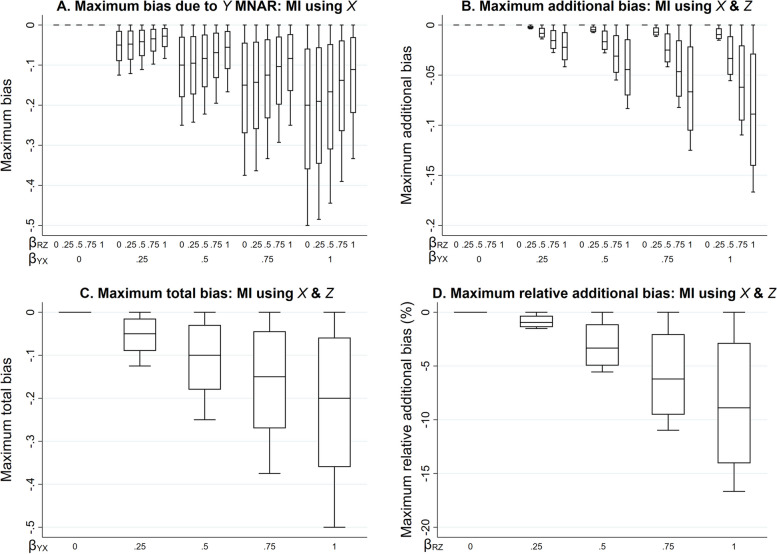
Fig. 2.
Bias of the MI estimator of when continuous outcome Y is missing not at random, with missingness caused by Y itself, and the imputation model includes exposure X, or X and a predictor of missingness but not the missing values, Z, varying the direct effect sizes , , and . Panel A depicts the maximum bias when the imputation model includes X. Panels B-D depict the maximum additional bias, maximum total bias, and maximum relative additional bias, respectively, when the imputation model includes X and Z. All bias quantities were calculated using Eqs. 2.1–2.3. The distribution of each box-plot is due to variation in . Note that maximum total bias depends on and but not ; maximum relative additional bias depends on and but not

