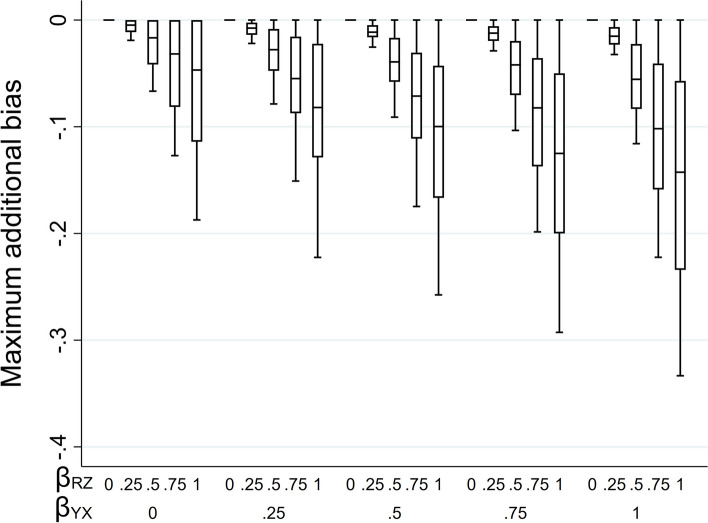
Fig. 6.
Maximum additional bias of the MI estimator of when continuous outcome Y is missing not at random, with missingness caused by Y and X, and the imputation model includes exposure X and a predictor of missingness but not the missing values, Z, varying the direct effect sizes , , , and . Maximum additional bias was calculated using Eq. 4.2. The distribution of maximum additional bias in each box-plot is averaged over the values of and

