Figure 1.
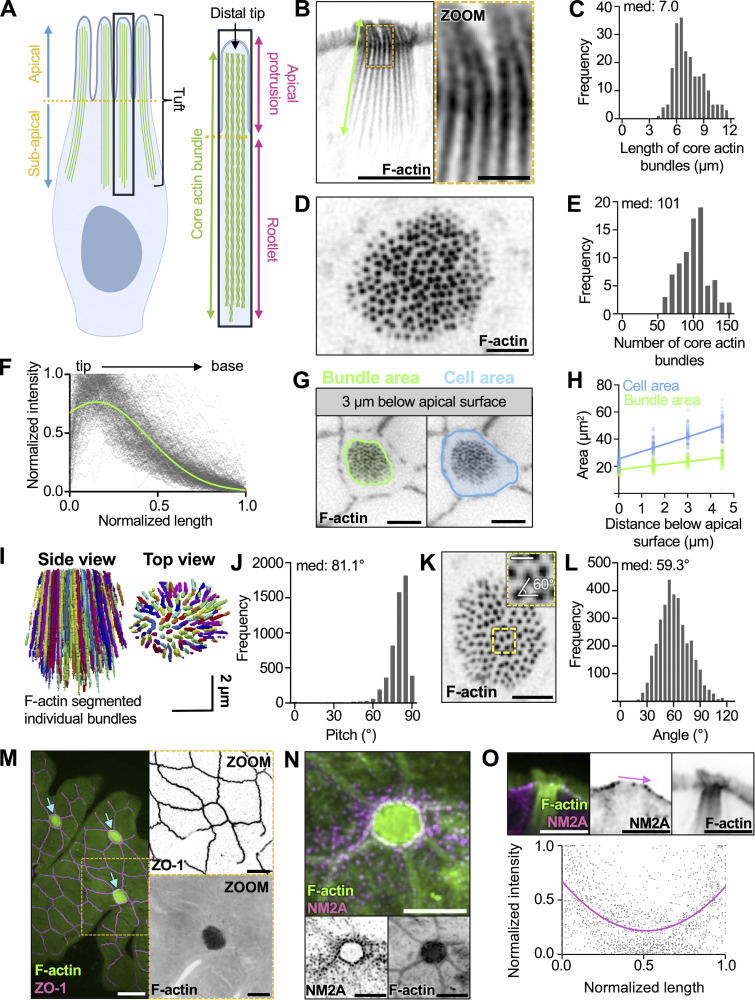
The tuft cell “tuft” contains over a hundred of core actin bundles. (A) Cartoon depicting nomenclature for core actin bundles in tuft cells. (B) Inverted single channel, single z-slice, Airyscan image of a lateral tissue section of tuft cell. Actin marked with phalloidin (scalebar = 5 µm, zoom = 1 µm). (C) Frequency diagram of core bundle length as depicted in B (n = 27 tuft cells over 3 mice). (D) Max intensity projection (MaxIP) spinning disk confocal (SDC) image using en face whole-mount tissue of a tuft cell captured beneath the apical membrane with phalloidin staining (scalebar = 2 µm). (E) Frequency diagram of the number of core actin bundles in tuft cells (n = 81 tuft cells over 3 mice). (F) Using lateral sections of frozen tissue, linescans of phalloidin intensity were drawn from the tip to the base of core actin bundles. Raw linescan data is shown in gray with a curve fit to data shown in green. (n = 218 bundles over 3 mice). (G) Single z-slice SDC image of en face whole-mount tissue (scalebar = 5 µm). (H) Simple linear regression measuring cell or bundle area (as shown in G) at 1.5, 3, and 4.5 µm beneath the apical surface. Slope bundle area = 2.013. Slope cell area = 5.412 (n = 54 tuft cells over 3 mice). (I) 3D projection of core actin bundles in a tuft cell using Trainable WEKA segmentation. (J) Pitch of individual actin bundles relative to the long axis of the cell (90° = vertical orientation) using WEKA segmented data from I (n = 35 tuft cells over 3 mice). (K) MaxIP SDC image of en face whole-mount tissue section with showing sub-apical core bundles (scalebar = 2 µm, inset box scalebar = 500 nm). (L) Frequency diagram of angle measurements between neighboring bundles as shown in zoom inset K (n = 3,453 measurements made in 25 tuft cells over 3 mice). (M) MaxIP SDC image of en face whole-mount tissue with ZO-1 (magenta) and actin marked by phalloidin (green). Arrows point to tuft cells. (scalebar = 5 µm). (N) MaxIP SDC image of en face frozen tissue section with NM2A (magenta) and actin marked with phalloidin (green) (scalebar = 5 µm). (O) Above: single z-slice image of a lateral frozen tissue section with NM2A (magenta) and actin marked with phalloidin (green) (scalebar = 5 µm). Below: linescans measuring the intensity of NM2A across the apical surface of tuft cells as shown by the pink arrow in the image above (n = 33 tuft cells over 3 mice).

