Figure 3.
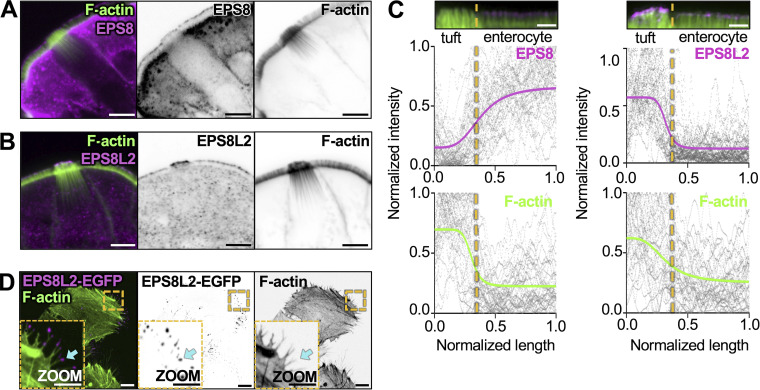
Filaments in core actin bundles exhibit uniform barbed-end out polarity. (A) MaxIP of laser scanning confocal image of EPS8 in tuft cells. Actin marked with phalloidin (scalebar = 5 µm). (B) MaxIP of laser scanning confocal image of EPS8L2 in tuft cells. Actin marked with phalloidin (scalebar = 5 µm). (C) Linescans drawn over a MaxIP image of the apical tuft and neighboring enterocyte microvilli, measuring EPS8 or EPS8L2 intensity in tuft cells and enterocytes, with accompanying phalloidin intensity. Images provided above as reference (scalebar = 2 µm). Raw data for all graphs are shown in gray, line fit (sigmoidal 4PL) in color. The line fit for EPS8 indicates a bottom plateau of 0.15 normalized intensity in tuft cells and a top plateau of 0.66 normalized intensity in enterocytes. The line fit for EPS8L2 indicates a bottom plateau of 0.13 normalized intensity in enterocytes and a top plateau of 0.57 normalized intensity in tuft cells. (n = EPS8: 37 tuft cells over 3 mice; EPS8L2: 33 tuft cells over 3 mice). (D) MaxIP SDC image of HeLa cells expressing EPS8L2-EGFP; cyan arrow points to filopodia tip (scalebar = 2 µm).

