Figure 5.
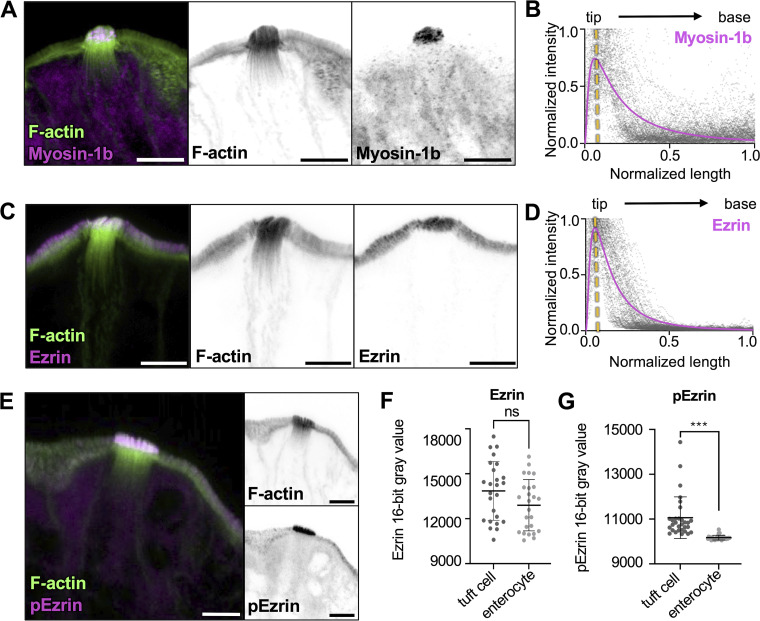
Core actin bundles show regionalization of tuft cell enriched membrane–actin-linking proteins. (A, C, and E) MaxIP Airyscan image of the lateral frozen tissue section and immunostained for actin-binding proteins and actin marked with phalloidin (scalebar = 5 µm). (B and D) Graph of linescans drawn from MaxIP images from apical tip to the base of core bundle, measuring intensity of actin binding proteins. Raw values are depicted in gray, line fit (lognormal) in magenta; yellow line indicates the peak of line fits (n = myosin-1b, 30 tuft cells; Ezrin, 27 tuft cells, over 3 mice). (F) Mean Ezrin intensity in tuft cells versus neighboring enterocytes, using a sum intensity projection, unpaired two-sided t test, P = 0.0723, error bars denote mean ± SD (n = 25 tuft cells over 3 mice). (G) Mean pEzrin intensity in tuft cells versus neighboring enterocytes, unpaired two-sided t test, P < 0.001 (n = 30 tuft cells over 3 mice). Error bars denote mean ± SD.

