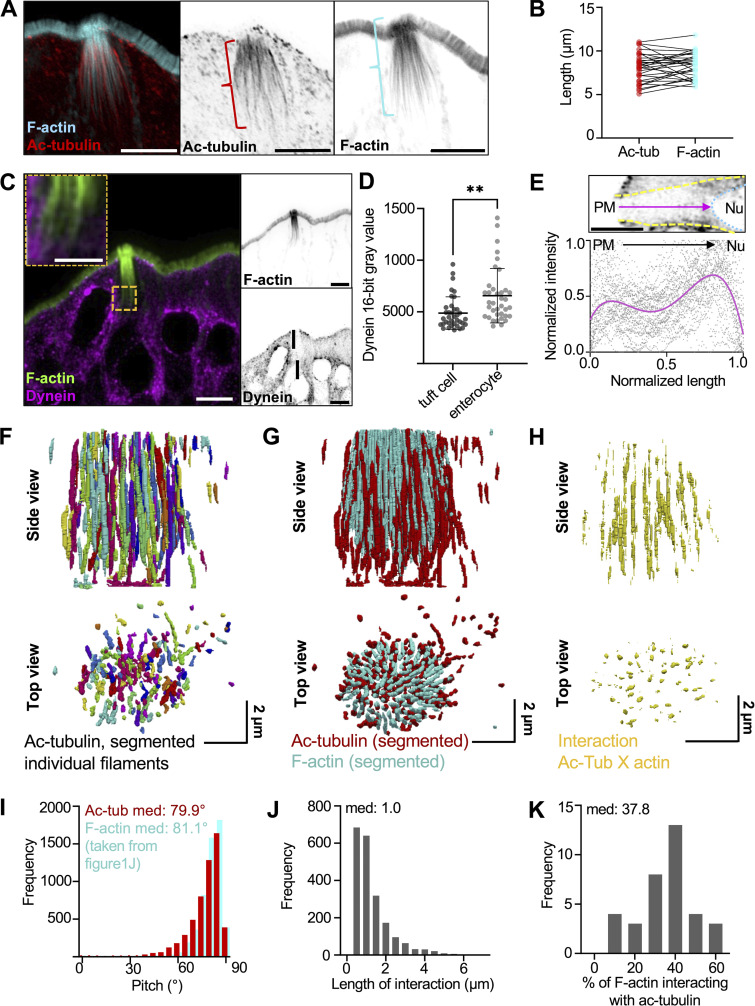
Figure 6.
Core actin bundles co-align and interdigitate with acetylated microtubules. (A) MaxIP Airyscan image of lateral tissue section (scalebar = 5 µm). (B) Graph of length of microtubule network versus actin network in tuft cells, as shown by brackets in A. Paired t test, P = 0.3472. (C) MaxIP SDC image of a lateral tissue section with dynein immunostaining. Actin marked with phalloidin (scalebar = 5 µm, zoom scalebar = 2 µm). (D) Mean dynein intensity measurements taken from sum intensity projections at the apical surface of tuft cells versus neighboring enterocytes, unpaired two-sided t test, P = 0.0013, error bars denote mean ± SD (n = 37 tuft cells over 3 mice). (E) Graph of linescan showing dynein intensity taken from MaxIP images at the apical surface of tuft cell to the top of nucleus. Image above depicts route of linescan (PM = plasma membrane, Nu. = nucleus, scalebar = 5 µm). Raw data shown in gray, and line fit (fourth-order polynomial) in magenta (n = 38 tuft cells over 3 mice). (F) 3D projection of acetylated tubulin network in a tuft cell using Trainable WEKA segmentation. (G) 3D projection of both actin and acetylated microtubule networks, taken from trainable WEKA segmented data. (H) Interaction between actin and microtubules considered as areas of overlap or immediate adjacency between both cytoskeletal networks and created via dilation of core actin bundles (×4) using the segmented data in G. (I) Frequency diagram showing pitch of microtubules using segmentation from F, data on actin pitch taken from Fig. 1 J (n = 35 tuft cells over 3 mice). (J) Frequency diagram of the length of individual interactions from H (n = 35 tuft cells over 3 mice). (K) Frequency diagram of the percentage of total actin within a tuft cell that is interacting with microtubules. Calculated as the total length of interaction (J) divided by the total length of actin per tuft cell (not shown).

