Figure 8.
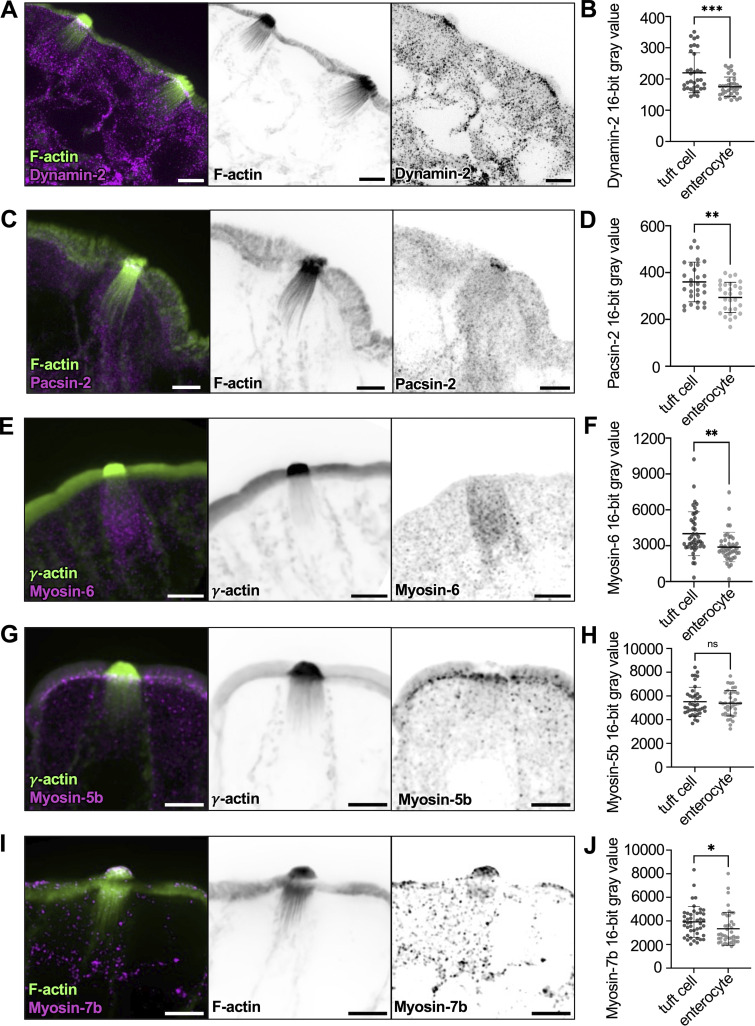
Tuft cells exhibit higher levels of trafficking machinery relative to enterocytes. (A and C) MaxIP SDC image of lateral frozen tissue section immunostained for dynamin-2 or pacsin-2, respectively. F-actin marked with phalloidin (scalebar = 5 µm). (B and D) Mean intensity measurements taken from sum intensity projections of dynamin-2 (unpaired two-sided t test, P = <0.001, n = 28 tuft cells over 3 mice) and pacsin-2 (unpaired two-sided t test, P = 0.0015, n = 34 tuft cells over 3 mice) in the apical surface of tuft cells versus enterocytes. Error bars denote mean ± SD. (E) MaxIP SDC image of lateral paraffin-embedded tissue section immunostained with myosin-6. Actin marked by γ-actin staining (scalebar = 5 µm). (F) Mean intensity measurements taken from sum intensity projections of myosin-6 (unpaired two-sided t test, P = 0.0014) using a line drawn from the apical surface of the cell to top of the nucleus in tuft cells versus enterocytes. Error bars denote mean ± SD. (G and I) MaxIP SDC image of lateral tissue section immunostained for (G) Myosin-7b (frozen tissue section, with F-actin marked by phalloidin) and (I) Myosin-5b (paraffin-embedded tissue with actin marked by γ-actin staining). Scalebar = 5 µm. (H and J) Mean intensity measurements are taken from sum-intensity projections of Myosin-5b (unpaired two-sided t test, P = 0.621, n = 39 tuft cells over 3 mice) and Myosin-7b (unpaired two-sided t test, P = 0.045, n = 44 tuft cells over 3 mice) in the apical surface of tuft cells versus enterocytes. Error bars denote mean ± SD.

