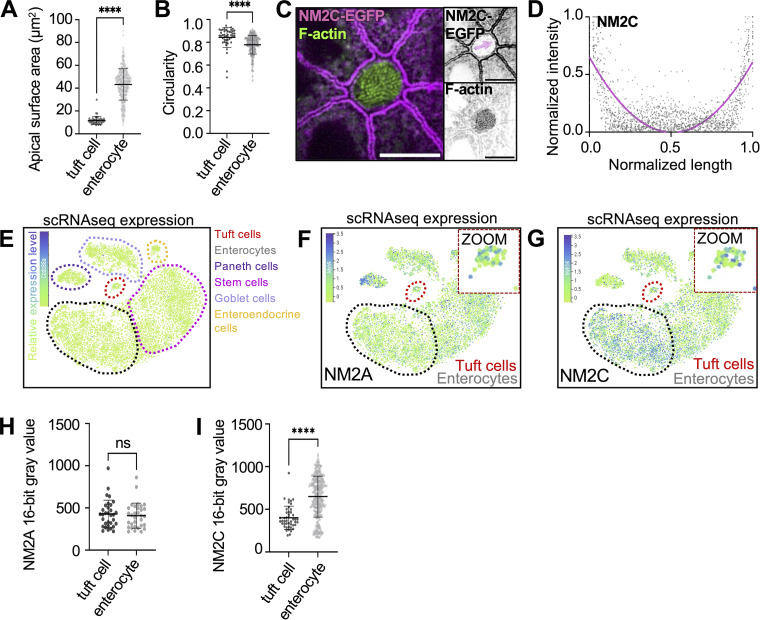
Figure S1.
NM2A and NM2C are present on the lateral apical junctions of tuft cells. (A) Apical surface area measurement using ZO-1 staining in whole-mount tissue as imaged in Fig. 1 M. Unpaired two-sided t test, P < 0.001, error bars denote mean ± SD (n = 45 tuft cells over 3 mice). (B) Apical circularity measurement using ZO-1 staining in whole-mount tissue as imaged in Fig. 1 M, unpaired two-sided t test, P < 0.001, error bars denote mean ± SD (n = 45 tuft cells over 3 mice). (C) MaxIP SDC image of en face whole-mount NM2C-EGFP tissue, actin stained with phalloidin (scalebar = 5 µm). (D) Graph of linescans for NM2C intensity drawn across the apical surface of a tuft cell (magenta arrow in B) in MaxIPs of NM2C-EGFP whole-mount tissue (n = 43 tuft cells over 3 mice). (E–G) t-SNE analysis of scRNA-seq data generated from mouse intestinal tissue. The common names of the protein products of the genes are labeled on each plot. Heatmap overlay represents the Arcsinh-scaled of normalized transcript count. Tuft cells red circle/zoom and enterocytes gray circle (n = 6 mice). (E) t-SNE plots showing cell types (dotted outlines). (F) t-SNE plot of myh9 (NM2A). (G) t-SNE plot of myh14 (NM2C). (H) Mean NM2A intensity measurements in tuft cells versus enterocytes in frozen tissue sections, unpaired two-sided t test, P = 0.6179, error bars denote mean ± SD (n = 32 tuft cells over 3 mice). (I) Mean NM2C intensity measurement in tuft cells versus enterocytes in whole-mount tissue sections, unpaired two-sided t test, P < 0.0001, error bars denote mean ± SD, (n = 46 tuft cells over 3 mice).

