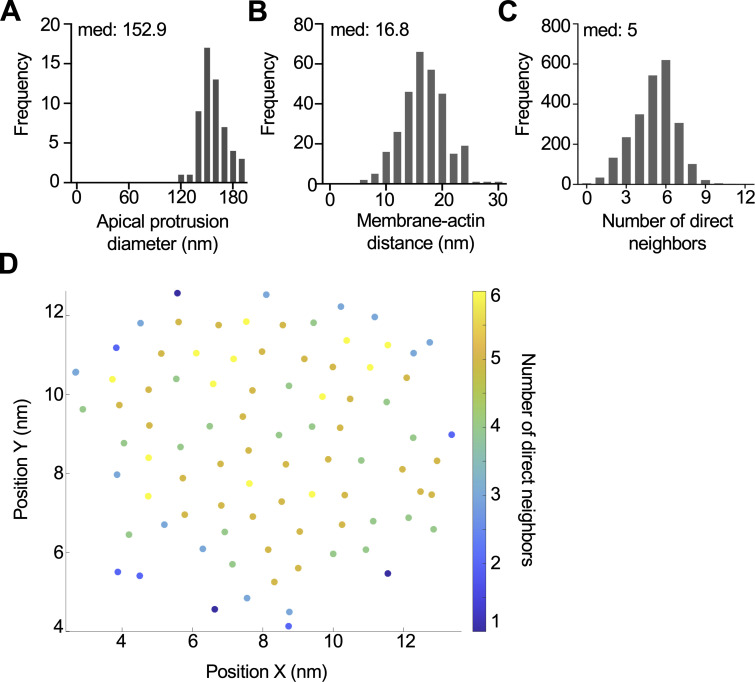
Figure S2.
Core actin bundles contain hexagonally packed filaments. (A) Frequency diagram of the apical protrusion diameter in tuft cells (n = 57 protrusions over 4 tuft cells). (B) Frequency diagram distance between outer protrusion membrane to actin measured at five separate places in each bundle (n = 30 bundles over 3 tuft cells). (C) Frequency diagram of the number of nearest filament neighbors (within a 12-nm radius) (n = 22 bundles over 3 tuft cells). (D) Example of nearest neighbor analysis showing a single core actin bundle and individual filaments. Filament coordinates were derived using Trackmate and put into a custom MATLAB script to quantify nearest neighbors (within a 12-nm radius). Filaments are color-coded based on the number of nearest neighbors.

