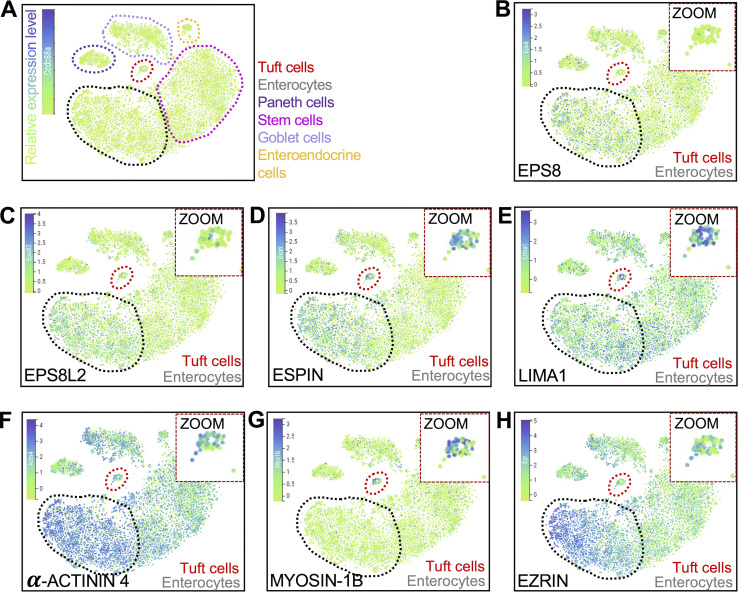
Figure S3.
t-SNE analysis of scRNA-seq data generated from mouse intestinal tissue. (A–H) t-SNE plots showing (A) cell types (dotted outlines), (B) Eps8, (C) Eps8l2, (D) Espn, (E) Lima1, (F) Actn4, (G) Myo1b, and (H) Ezrn. Measurements in tuft cells—red circle/zoom and in enterocytes—gray circle (n = 6 mice). The common names of the protein products of the genes are labeled on each plot. Heatmap overlay represents the Arcsinh-scaled normalized transcript count.

