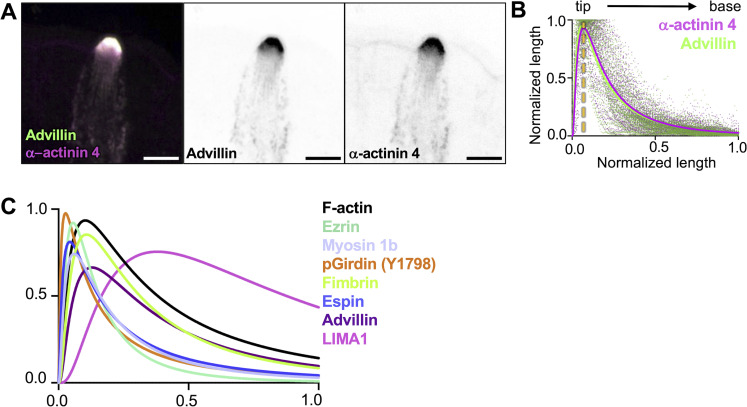
Figure S4.
Distribution of actin-binding proteins along the core bundle axis. (A) MaxIP SDC image of paraffin-embedded tissue and immunostained for α-actinin 4 and Advillin (scalebar = 5 µm). (B) Graph of linescans drawn from MaxIP images from apical tip to the base of core bundle, measuring the intensity of actin-binding proteins. Line fit (lognormal) in magenta for α-actinin 4 and green for advillin with raw values for both proteins in magenta and green, respectively. The yellow line indicates the peak of line fits (n = 35 tuft cells over 3 mice). (C) Overlayed line fits (lognormal) from actin binding proteins in Fig. 4, B, D, F, H, and J.

