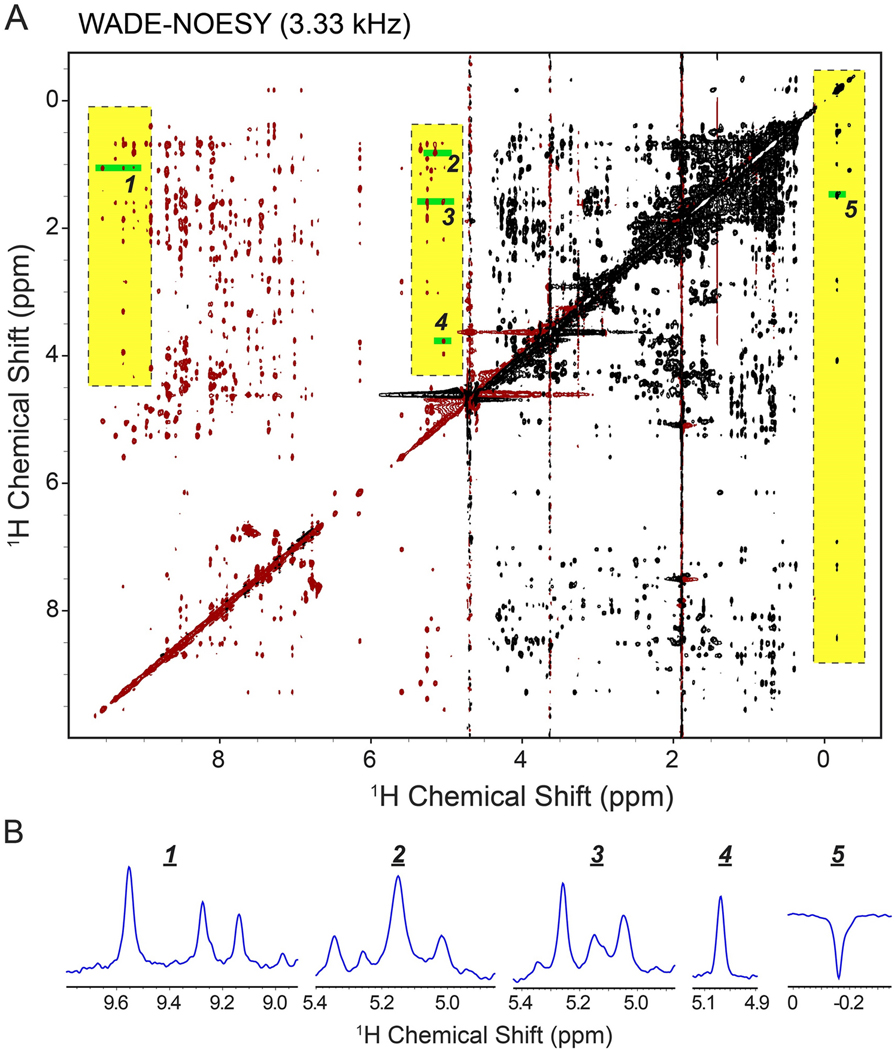
Figure 7.
(A) [1H-1H] WADE-NOESY of UBIK48C with WADE pulses of 3.33 kHz to improve peak detections near the water signal. The highlighted regions emphasize resonances with a significantly higher intensity than those in the ES-NOESY. The experiment was performed on a Bruker 850 MHz spectrometer at 303 K. 128 number of complex points were acquired in indirect dimension and 4 scans per FID with a relaxation delay of 2 sec. (B) 1D slices from near water and far off resonance regions of the spectrum.

