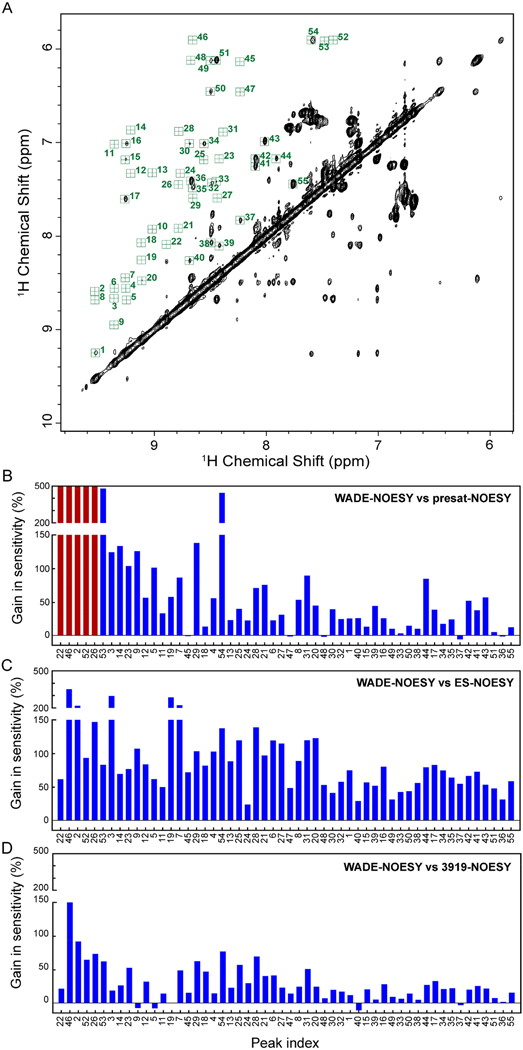
Figure 9.
Comparison of cross peak intensities for the different pulse sequences. (A) Amide region of UBIK48C. For simplicity, the cross-peaks were indicated with random numbers. Sensitivity gain of the NOE cross peaks of the 2D [1H,1H] WADE-NOESY relative to (B) presat-NOESY (noesyphpr). Red bars represent the peaks that broaden out due to exchange. (C) ES-NOESY (noesyesgpph), and (D) 3919-NOESY (noesygpph19). All experiments were recorded on Bruker 900 MHz spectrometer at 300K with 128 complex time points in indirect dimension and 8 scans per FID. A relaxation delay of 2 sec was used for all the experiments. The spectra were processed with identical processing parameters.

