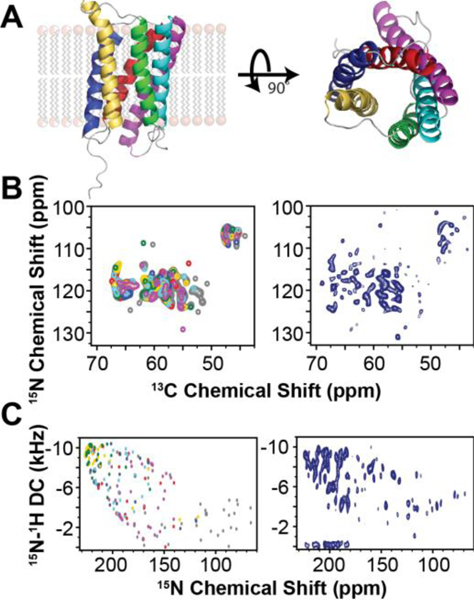
Figure 8:
Integrated MAS and OS-ssNMR spectroscopy of SaTP in lipid membranes. A. X-ray structure of SaTP (PDB 5ZUG). B. Predicted MAS NCA spectrum (left) using the ShiftX2 Server versus experimental NCA spectrum (right). C. Predicted SE-PISEMA spectrum obtained from MD simulation versus experimental SE-PISEMA spectrum (right).

