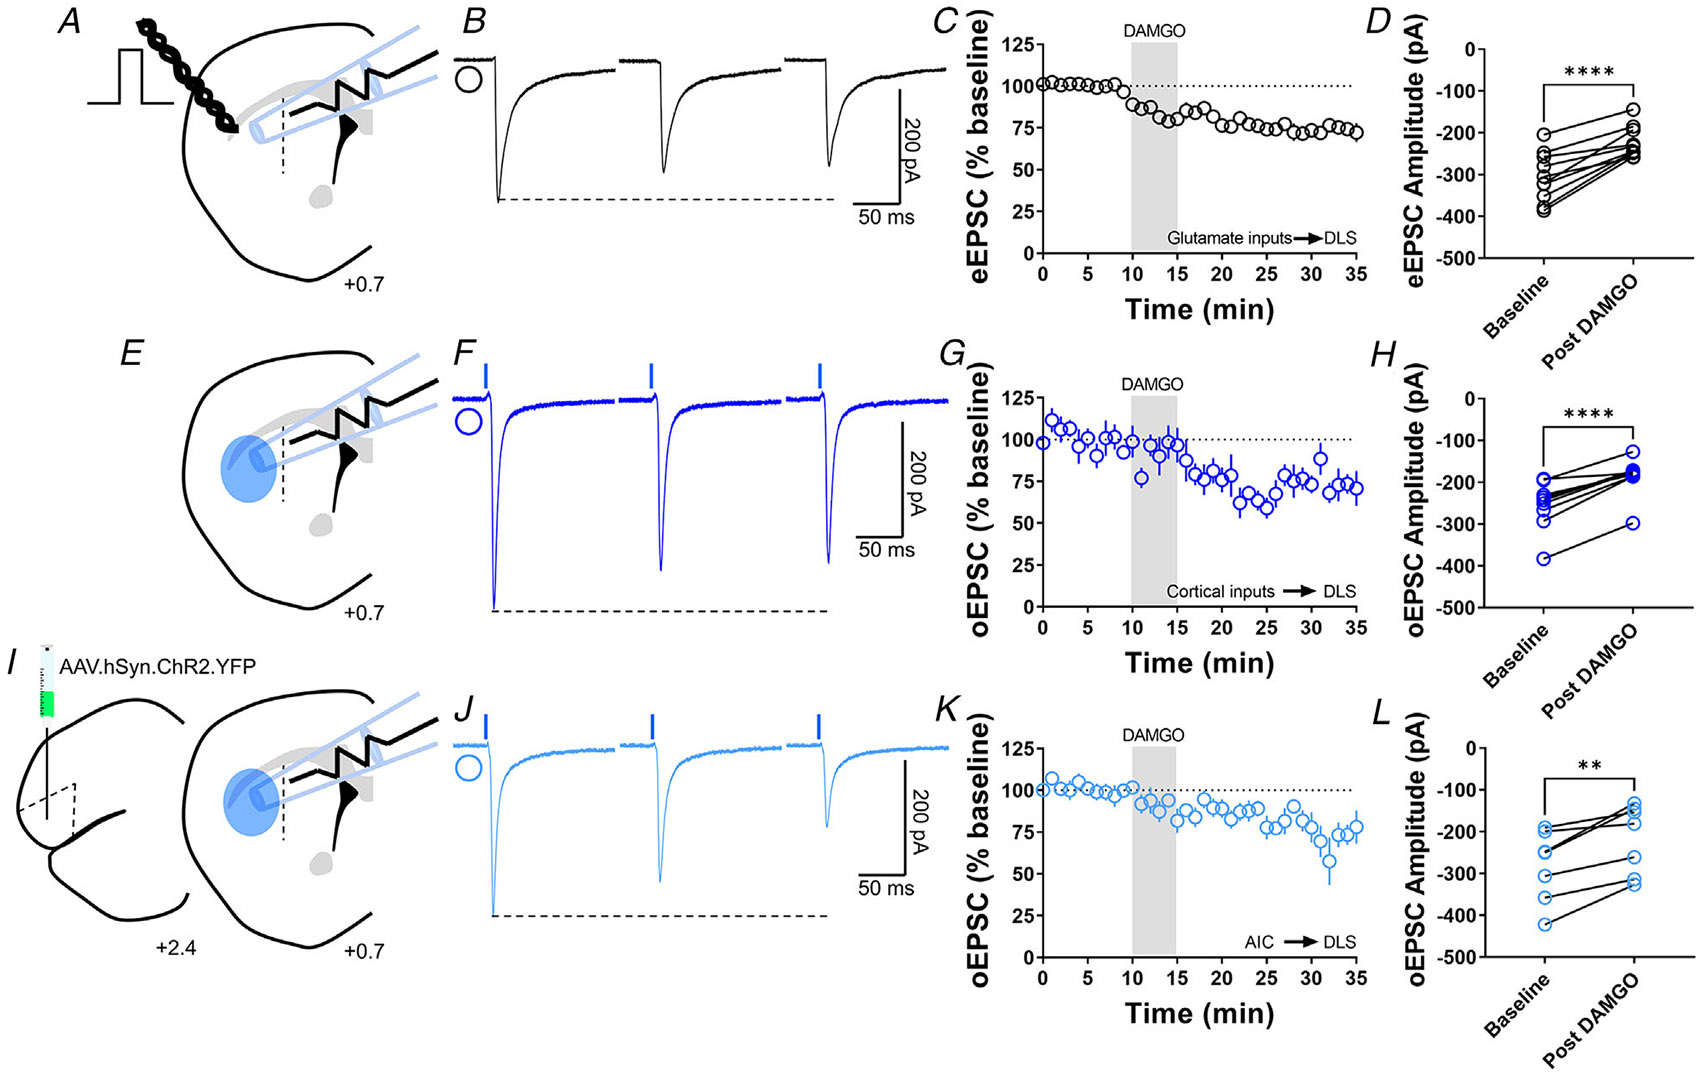
Figure 1. MOR activation induces glutamatergic LTD in the DLS.

A, schematic representation of coronal brain slice showing the recording of EPSCs evoked by focal electric stimulation in the DLS of C57BL/6J mice. B, representative electrically evoked EPSC traces before, during and after DAMGO (0.3 μM, 5 min) application. C, the activation of MOR by DAMGO induced glutamatergic LTD in DLS MSNs of C57BL/6J mice (final 10 min of recording average: 74 ± 3%). D, eEPSC amplitudes in MSNs within DLS were significantly reduced after DAMGO application (0–10 min baseline vs. final 10 min of recording; paired t test, P < 0.0001, t9 = 6.688, n = 10 neurons from five mice). E, schematic representation of coronal brain slice showing the recording of EPSCs evoked by focal optical stimulation (470 nm blue light for 5 ms exposure) in the DLS of Emx1-Ai32 mice. F, representative optically evoked EPSC traces before, during and after DAMGO (0.3 μM, 5 min) application. G, the activation of MOR by DAMGO induced corticostriatal LTD in DLS MSNs of Emx1-Ai32 (final 10 min of recording average: 75 ± 3%). H, oEPSC amplitudes were significantly reduced after DAMGO application (0–10 min baseline vs. final 10 min of recording; paired t test, P < 0.0001, t8 = 7.73, n = 9 neurons from four mice). I, schematic figure of the injection paradigm showing an AAV vector encoding for ChR2 (AAV.hSyn.ChR2.YFP) in AIC in C57BL/6J mice, this AAV was injected 2 weeks prior to recordings. Also, the next schematic representation of coronal brain slice shows the recording of oEPSCs (470 nm blue light for 5 ms exposure) in the DLS. J, representative AIC-DLS oEPSC traces before, during and after DAMGO (0.3 μM, 5 min) application. K, DAMGO induced AIC-DLS LTD (final 10 min of recording average: 76 ± 5%). L, DAMGO application significantly reduced oEPSC amplitudes (0–10 min baseline vs. final 10 min of recording; paired t test, P = 0.00403, t6 = 4.5, n = 7 neurons from four mice). Data represent means ± SEM. **P < 0.01, ****P < 0.0001.
