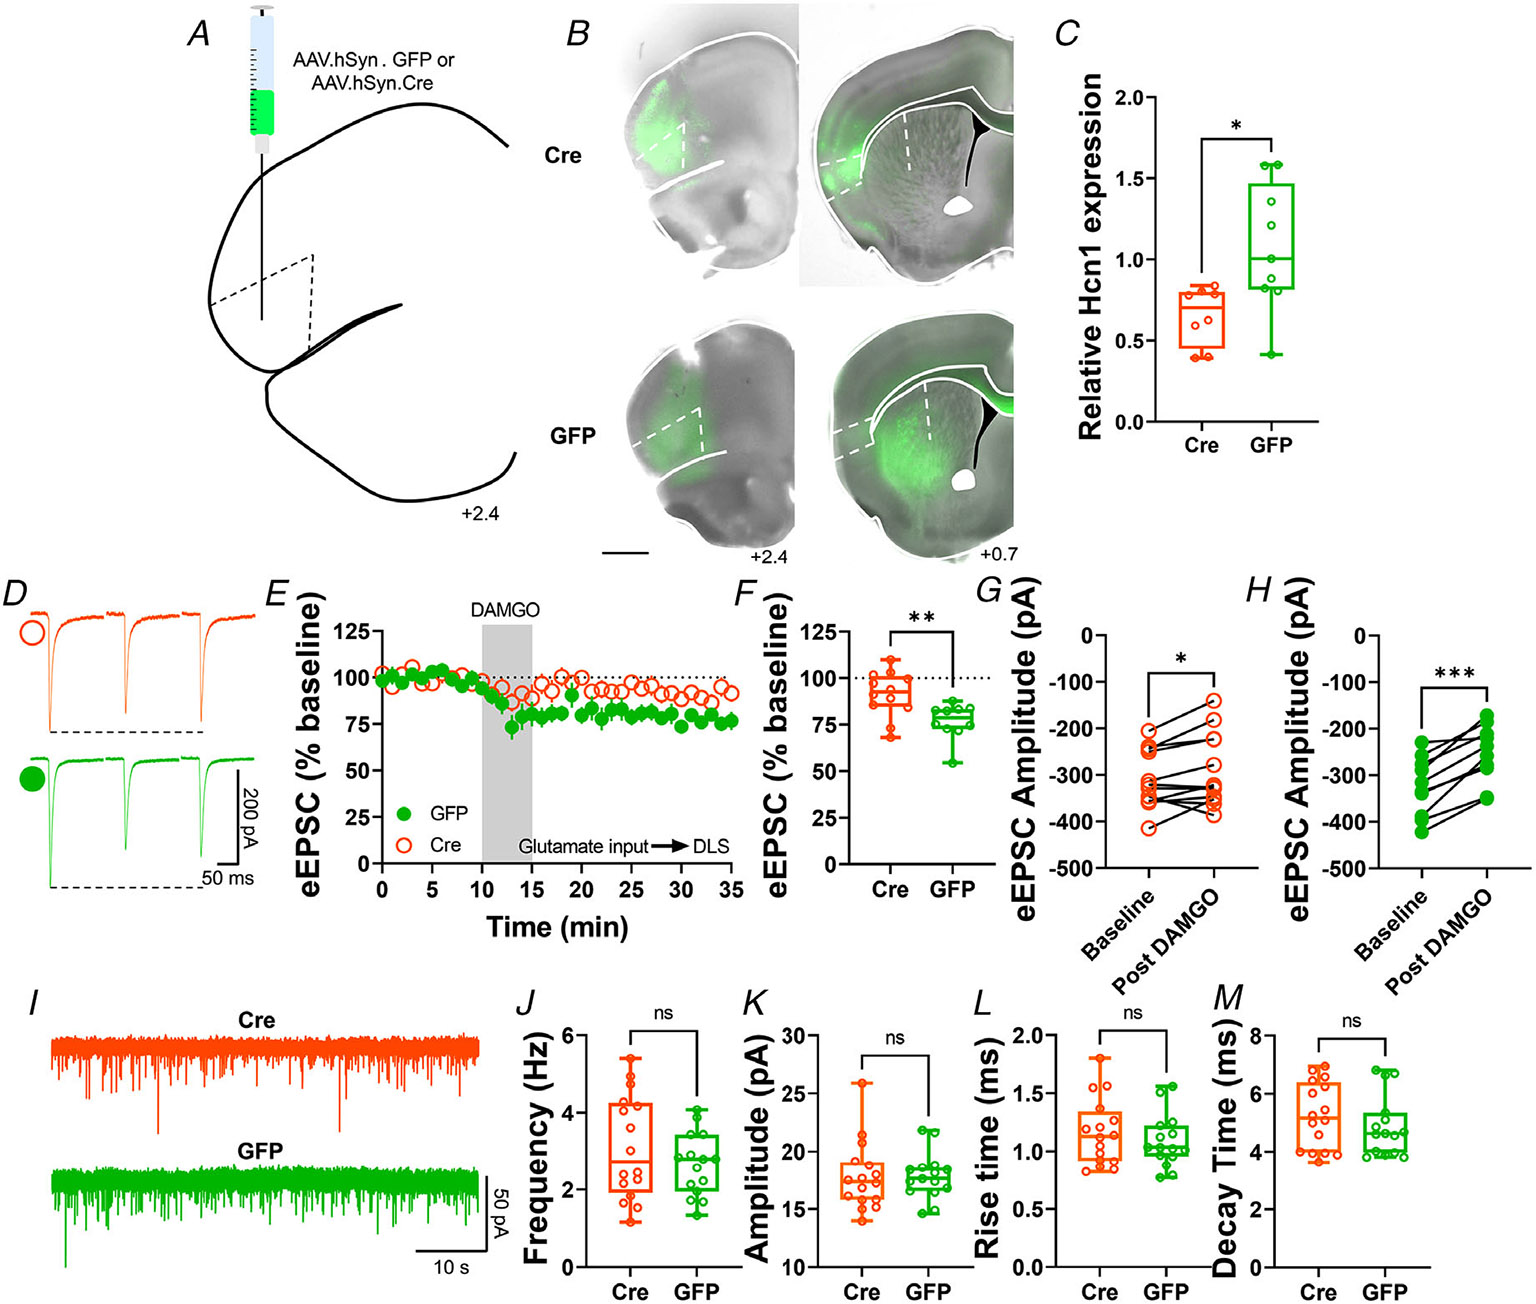
Figure 11. Genetic ablation of HCN1 channels in the AIC reduces MOR-mediated LTD expression in the DLS.

A, schematic figure of coronal brain slice showing injection paradigm enabling knock out of HCN1 channel expression in AIC in HCN1-flox mice. An AAV vector encoding for either cre-recombinase (AAV.hSyn.cre) or eGFP (AAV.hSyn.eGFP) was injected at least 4 weeks prior to recordings. B, coronal brain slice showing the AAV-cre or AAV-GFP infection of AIC and dorsal striatal terminal expression (bar scale = 1000 μm). C, AAV.cre reduced the expression of HCN1 in the AIC after 4 weeks post-injection (cre: 0.65 ± 0.06 vs. GFP: 1.07 ± 0.13, unpaired t test, P = 0.0139, t15 = 2.785, n = 8 cre-injected mice and n = 8 GFP-injected mice). D, representative eEPSC traces showing the effects of DAMGO (0.3 μM, 5 min) application in brain slices of AAV-injected HCN1-flox mice. E–F, the conditional decrease of HCN1 channel from AIC, blunted MOR-LTD in DLS (cre: 91 ± 4% vs. GFP: 77 ± 3%, unpaired t test, P = 0.00634, t20 = 3.05, n = 12 neurons from six cre-injected mice and n = 10 neurons from four GFP-injected mice). G, HCN1 reduction did not fully disrupt MOR-LTD, because there was still a small, but significant reduction of eEPSC amplitude after DAMGO application (0–10 min baseline vs. final 10 min of recording; paired t test, P = 0.0415, t11 = 2.31, n = 12 neurons from six mice). H, control GFP-injected mice showed normal decrease of eEPSC amplitude after DAMGO application 0–10 min baseline vs. final 10 min of recording; paired t test, P = 0.000101, t9 = 6.55, n = 10 neurons from four mice). I, representative synaptic current traces from HCN1-flox mice showing the spontaneous excitatory postsynaptic currents (sEPSCs) in AAV-cre (orange trace) and AAV-GFP (green trace) injected mice. J–M, HCN1 channel ablation from AIC synapses did not affect frequency (cre: 3.1 ± 0.3 Hz vs. GFP: 2.7 ± 0.2 Hz, unpaired t test, P = 0.277, t29 = 1.11, n = 16 neurons from four cre-injected mice and n = 15 neurons from three GFP-injected mice), amplitude (cre: 17.8 ± 0.7 pA vs. GFP: 17.8 ± 0.5 pA, unpaired t test, P = 0.980, t29 = 0.025, n = 16 neurons from four cre-injected mice and n = 15 neurons from three GFP-injected mice), rise time (cre: 1.16 ± 0.07 ms vs. GFP: 1.09 ± 0.06 ms, unpaired t test, P = 0.415, t29 = 0.822, n = 16 neurons from four cre-injected mice and n = 15 neurons from three GFP-injected mice) and decay time (cre: 5.24 ± 0.29 ms vs. GFP: 4.9 ± 0.27 ms, unpaired t test, P = 0.395, t29 = 0.396, n = 16 neurons from four cre-injected mice and n = 15 neurons from three GFP-injected mice) of the sEPSC events in DLS. Time course data represent means ± SEM. Box plots show average of the final 10 min of recording and represent median and interquartile ranges. ns = not significant, *P < 0.05, **P < 0.01, ***P < 0.001.
