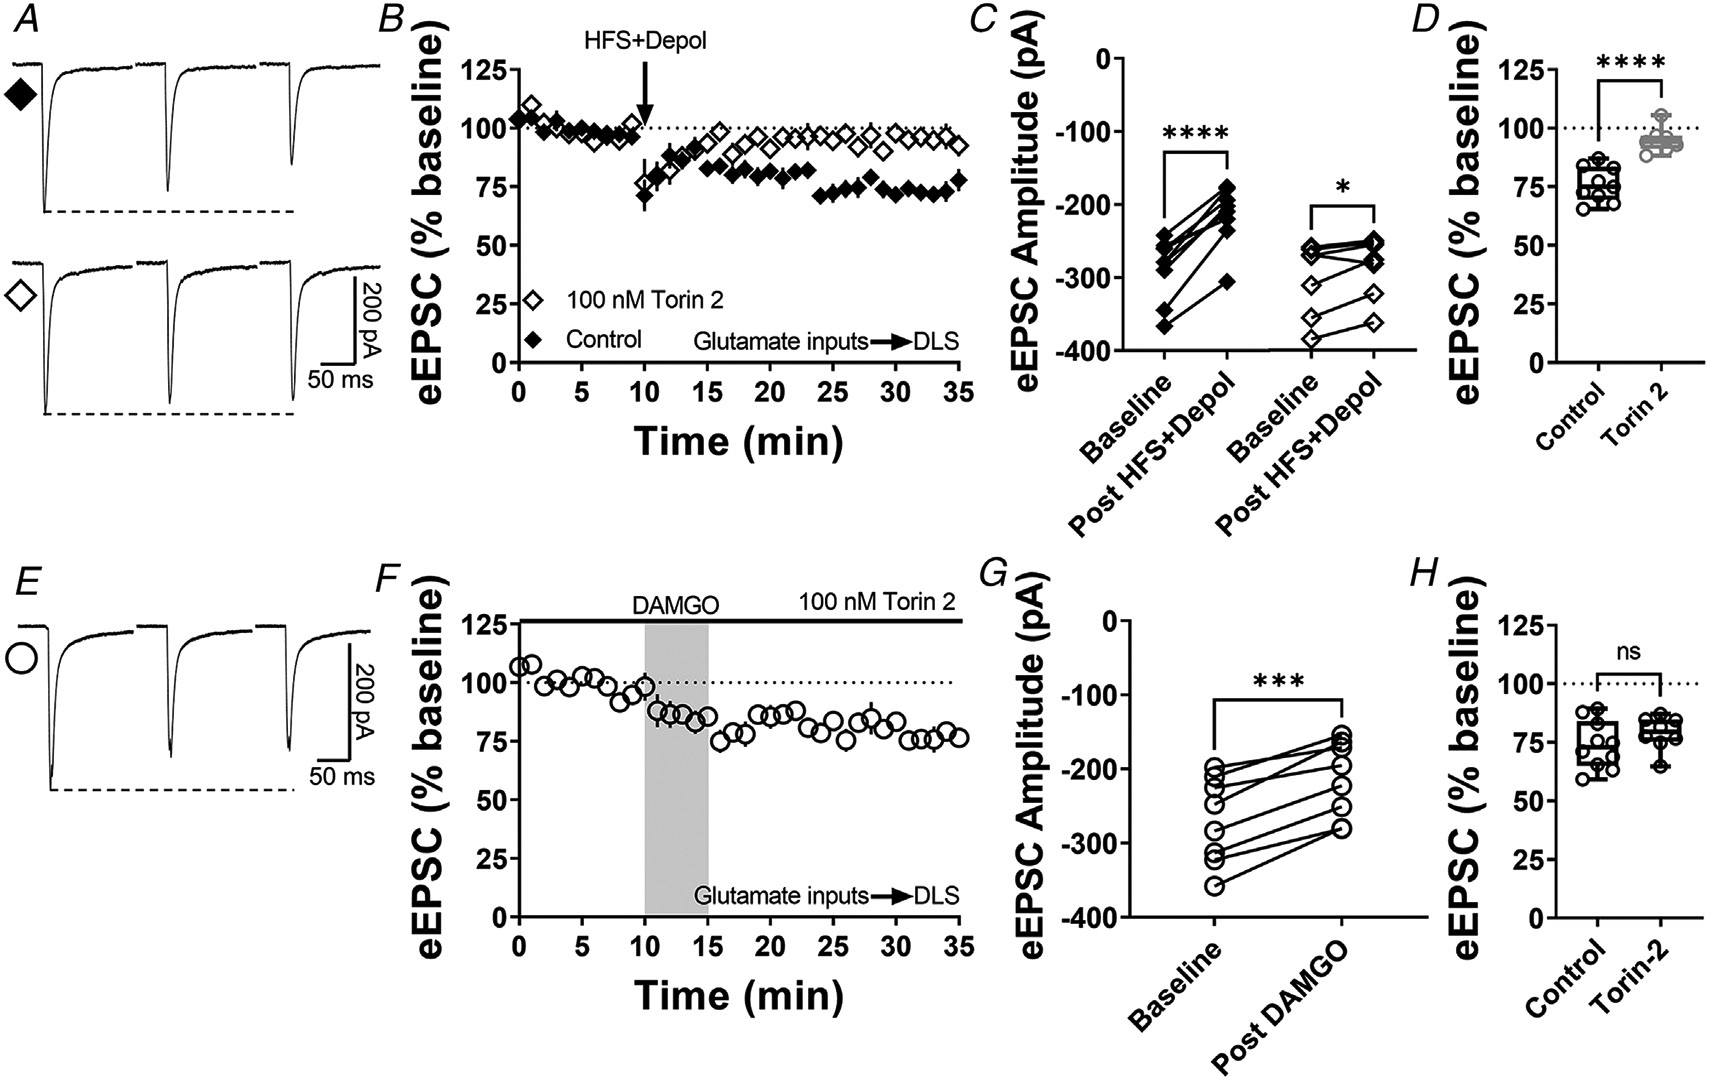
Figure 8. mTOR pathway is involved in cannabinoid-LTD but not in MOR-LTD in the DLS.

A, representative eEPSC traces before and after high-frequency stimulation (HFS) coupled with depolarization (four pulses of 100 Hz, 10 s inter-pulse interval), showing the effects of torin 2 (100 nM) bath application in brain slices of C57BL/6J mice. B–C, mTOR inhibition blocked this stimulation-induced cannabinoid-LTD in DLS (0–10 min baseline vs. final 10 min of recording; Control: paired t test, P < 0.0001, t8 = 8.6, n = 9 neurons from four mice; torin 2: paired t test, P = 0.0396, t6 = 2.62, n = 7 neurons from three mice). D, torin 2 disrupted stimulation-induced LTD in the DLS (control: 76 ± 3% vs. torin 2: 95 ± 2, unpaired t test, P < 0.0001, t14 = 5.64). E, representative eEPSC traces before and after DAMGO bath application (0.3 μM, 5 min), showing the effects of torin 2 (100 nM) bath application in brain slices of C57BL/J. F–G, mTOR inhibition did not affect the expression of MOR-LTD in DLS (0–10 min baseline vs. final 10 min of recording; paired t test, P = 0.000140, t7 = 7.48, n = 8 neurons from three mice). H, torin 2 did not block MOR-LTD in the DLS (control: 74 ± 3% vs. torin 2: 79 ± 3, unpaired t test, P = 0.270, t16 = 1.19). Time course data represent means ± SEM. Box plots show average of the final 10 min of recording and represent median and interquartile ranges. ns = not significant, *P < 0.05, ***P < 0.001, ****P < 0.0001.
