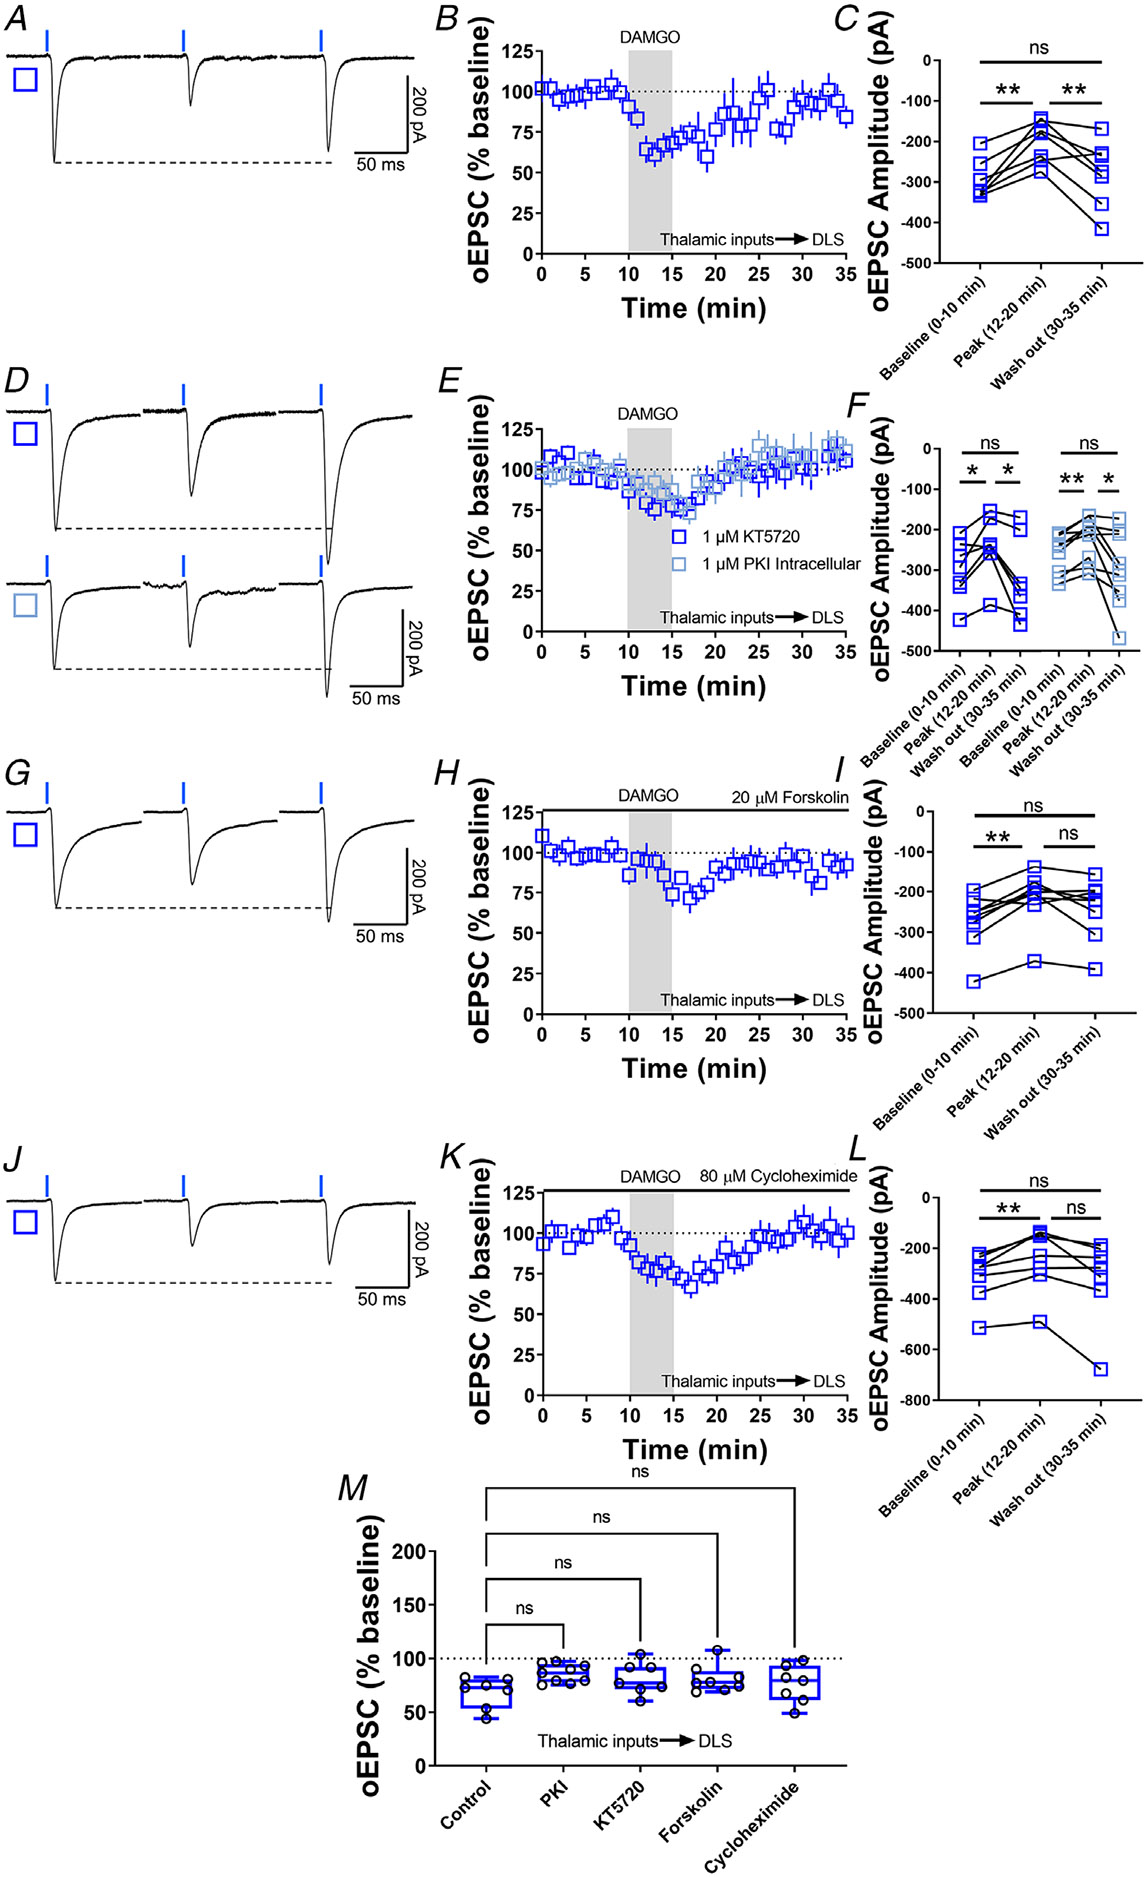
Figure 9. MOR-STD is not affected by PKA inhibition, cAMP activation or protein translation inhibition.

A, representative optically evoked EPSC traces before, during and after DAMGO (0.3 μM, 5 min) application in brain slices from VGluT2-Ai32 mice. B–C, thalamocortical inputs produced MOR-STD in DLS from VGluT2-Ai32 mice (10 min baseline vs. peak 12–20 min of recording P = 0.00275; 12–20 min Peak vs. 30–35 min Wash out of recording, P = 0.0889, repeated measure one-way ANOVA Tukey’s test, n = 7 neurons from three mice). D, representative oEPSC traces showing the effects of DAMGO (0.3 μM, 5 min) application after the preincubation of PKA-selective inhibitor KT5720 (1 μM, ≥1 h, blue open square) and after the intracellular dialysis of PKI (1 μM, ≥30 min, cyan open square). E–F, the inhibition of pre (1 μM KT5720) and postsynaptic PKA (1 μM PKI) did not affected MOR-STD (KT5720: 10 min baseline vs. peak 12–20 min of recording, P = 0.0353; 12–20 min Peak vs. 30–35 min Wash out of recording, P = 0.0353, repeated measure one-way ANOVA Tukey’s test, n = 7 neurons from three mice) (PKI: 10 min baseline vs. peak 12–20 min of recording, P = 0.00218; 12–20 min Peak vs. 30–35 min Wash out of recording, P = 0.0429, repeated measure one-way ANOVA Tukey’s test, n = 9 neurons from three mice). G, representative oEPSC traces showing the effects of 20 μM forskolin before, during and after DAMGO (0.3 μM, 5 min) application in brain slices from VGluT2-Ai32 mice. H–I, MOR-STD was unaffected after the activation of AC by 20 μM forskolin (10 min baseline vs. peak 12–20 min of recording, P = 0.00260; 12–20 min Peak vs. 30–35 min Wash out of recording, P = 0.168, repeated measure one-way ANOVA Tukey’s test, n = 8 neurons from four mice). J, representative oEPSC traces showing the effects of 80 μM cycloheximide before, during and after DAMGO (0.3 μM, 5 min) application in brain slices from VGluT2-Ai32 mice. K–L, protein translation is not necessary for the expression of MOR-STD (10 min baseline vs. peak 12–20 min of recording, P = 0.00973; 12–20 min Peak vs. 30–35 min Wash out of recording, P = 0.0822, repeated measure one-way ANOVA Tukey’s test, n = 7 neurons from three mice). M, the box plot illustrates the average peak current (12–20 min) and summarize the findings on MOR-STD mechanism in the DLS (one-way ANOVA Dunnett’s multiple comparisons test). Time course data represent means ± SEM. Box plots represent median and interquartile ranges and show average peak responses (12–20 min). ns = not significant, *P < 0.05, **P < 0.01.
