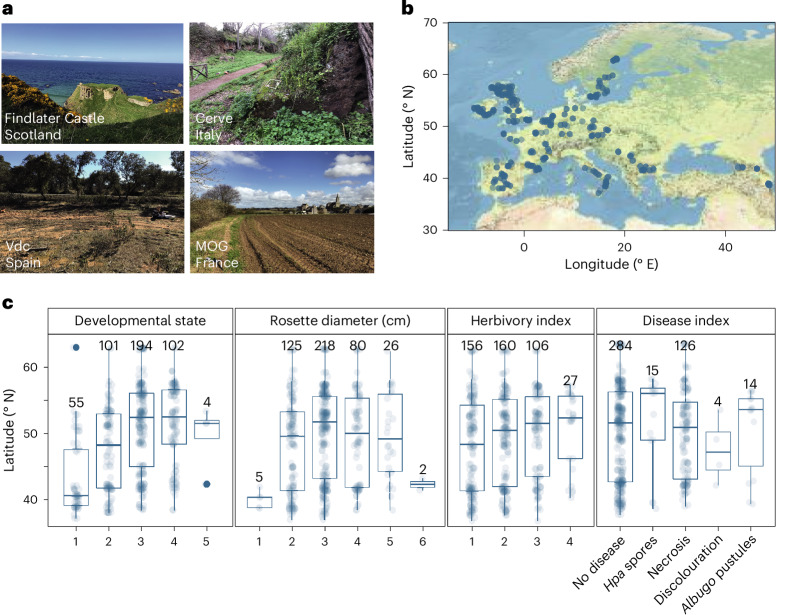
Fig. 1. Representative sampling of A. thaliana phyllosphere microbiomes across Europe.
a,b, A. thaliana plants were collected from distinct ecosystems. a, Examples of aspects of collection locations. b, Latitude/longitude of all locations. MOG is an acronym for Moguériec, France, and Vdc for Villaviciosa de Córdoba, Spain. c, Based on images of individual plants taken at each site, we assessed plant health and development. The x axis represents qualitative values (Methods), except for the rosette diameter, which is classified in intervals of (1) 0–1 cm, (2) 1–2 cm and so on. The disease index corresponds to different macroscopic disease symptoms as indicated (Hpa, Hyaloperonospora arabidopsidis). The central horizontal line in each box indicates the median, the bounds indicate the upper and lower quartiles and the number above the boxes indicates the individuals in each group.

