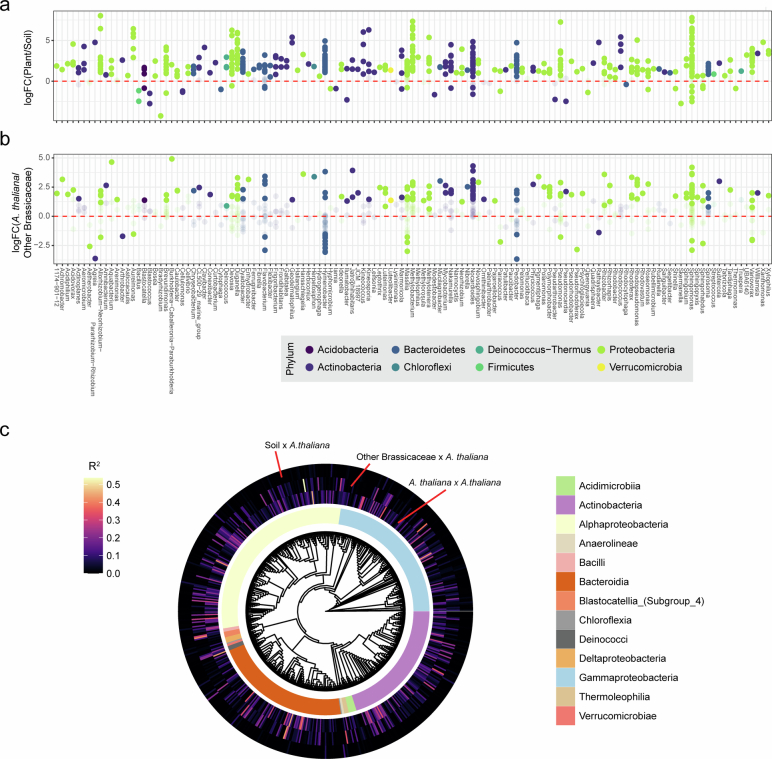
Extended Data Fig. 2. Differential abundance of phylotypes in soil, A. thaliana phyllospheres, and phyllospheres of other Brassicaceae.
a, 91% of phylotypes were differentially abundant between A. thaliana and soil. b, 36% of phylotypes were differentially abundant between A. thaliana and other Brassicaceae. Bold points indicate significance with an FDR ≤ 0.01. c, Within-site correlation of phylotype abundance. Correlation coefficients (scale on top left) were calculated for the co-occurrence of a phylotype within a site between the two A. thaliana plants collected at the site, A. thaliana x A. thaliana (third ring from the outside), other Brassicaceae x A. thaliana (second ring from the outside), and soil x A. thaliana (outermost ring). The central tree in the Circos plot represents the maximum likelihood tree of phylotypes, plotted without inferred branch lengths75.

