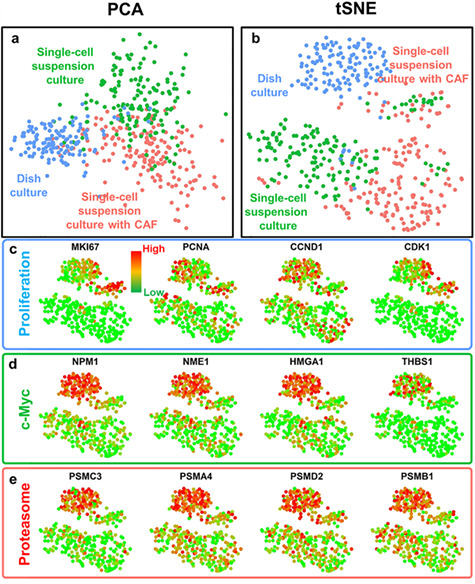
Figure 3 .

Distinct gene expression profiles of SUM149 breast cancer cells from different culture conditions. (a, b) Principal component analysis (PCA) and t-distributed Stochastic Neighbor Embedding (tSNE) plots of single-cell transcriptome analysis for single-cell suspension cultured with CAFs (red color), single-cell suspension cultured without CAFs (green color) and dish cultured (blue color) cancer cells. Three populations of the same cell line are clearly separated, indicating distinct gene expression profiles under different culture conditions. (c–e) Gene expression and clustering of SUM149 cells from different culture conditions. Each dot represents one cell. Red color represents high (90th percentile) expression of a gene, and green color represents low (10th percentile) expression of a gene. The expression is logarithmically normalized. (c) The expression of proliferation-related genes: proliferation marker protein Ki-67 (MKI67), proliferating cell nuclear antigen (PCNA), cyclin D1 (CCND1) and cyclin-dependent kinase 1 (CDK1). (d) The expression of c-Myc pathway-related genes: nucleophosmin (NPM1), nucleoside diphosphate kinase A (NME1), high mobility group AT-hook 1 (HMGA1), and thrombospondin 1 (THBS1). (e) The expression of proteasome genes: proteasome 26S Subunit ATPase 3 (PSMC3), proteasome subunit alpha 4 (PSMA4), proteasome 26S subunit, non-ATPase 2 (PSMD2) and proteasome subunit beta 1 (PSMB1). Dish-cultured cells have elevated proliferative, c-Myc-related and proteasome genes.
