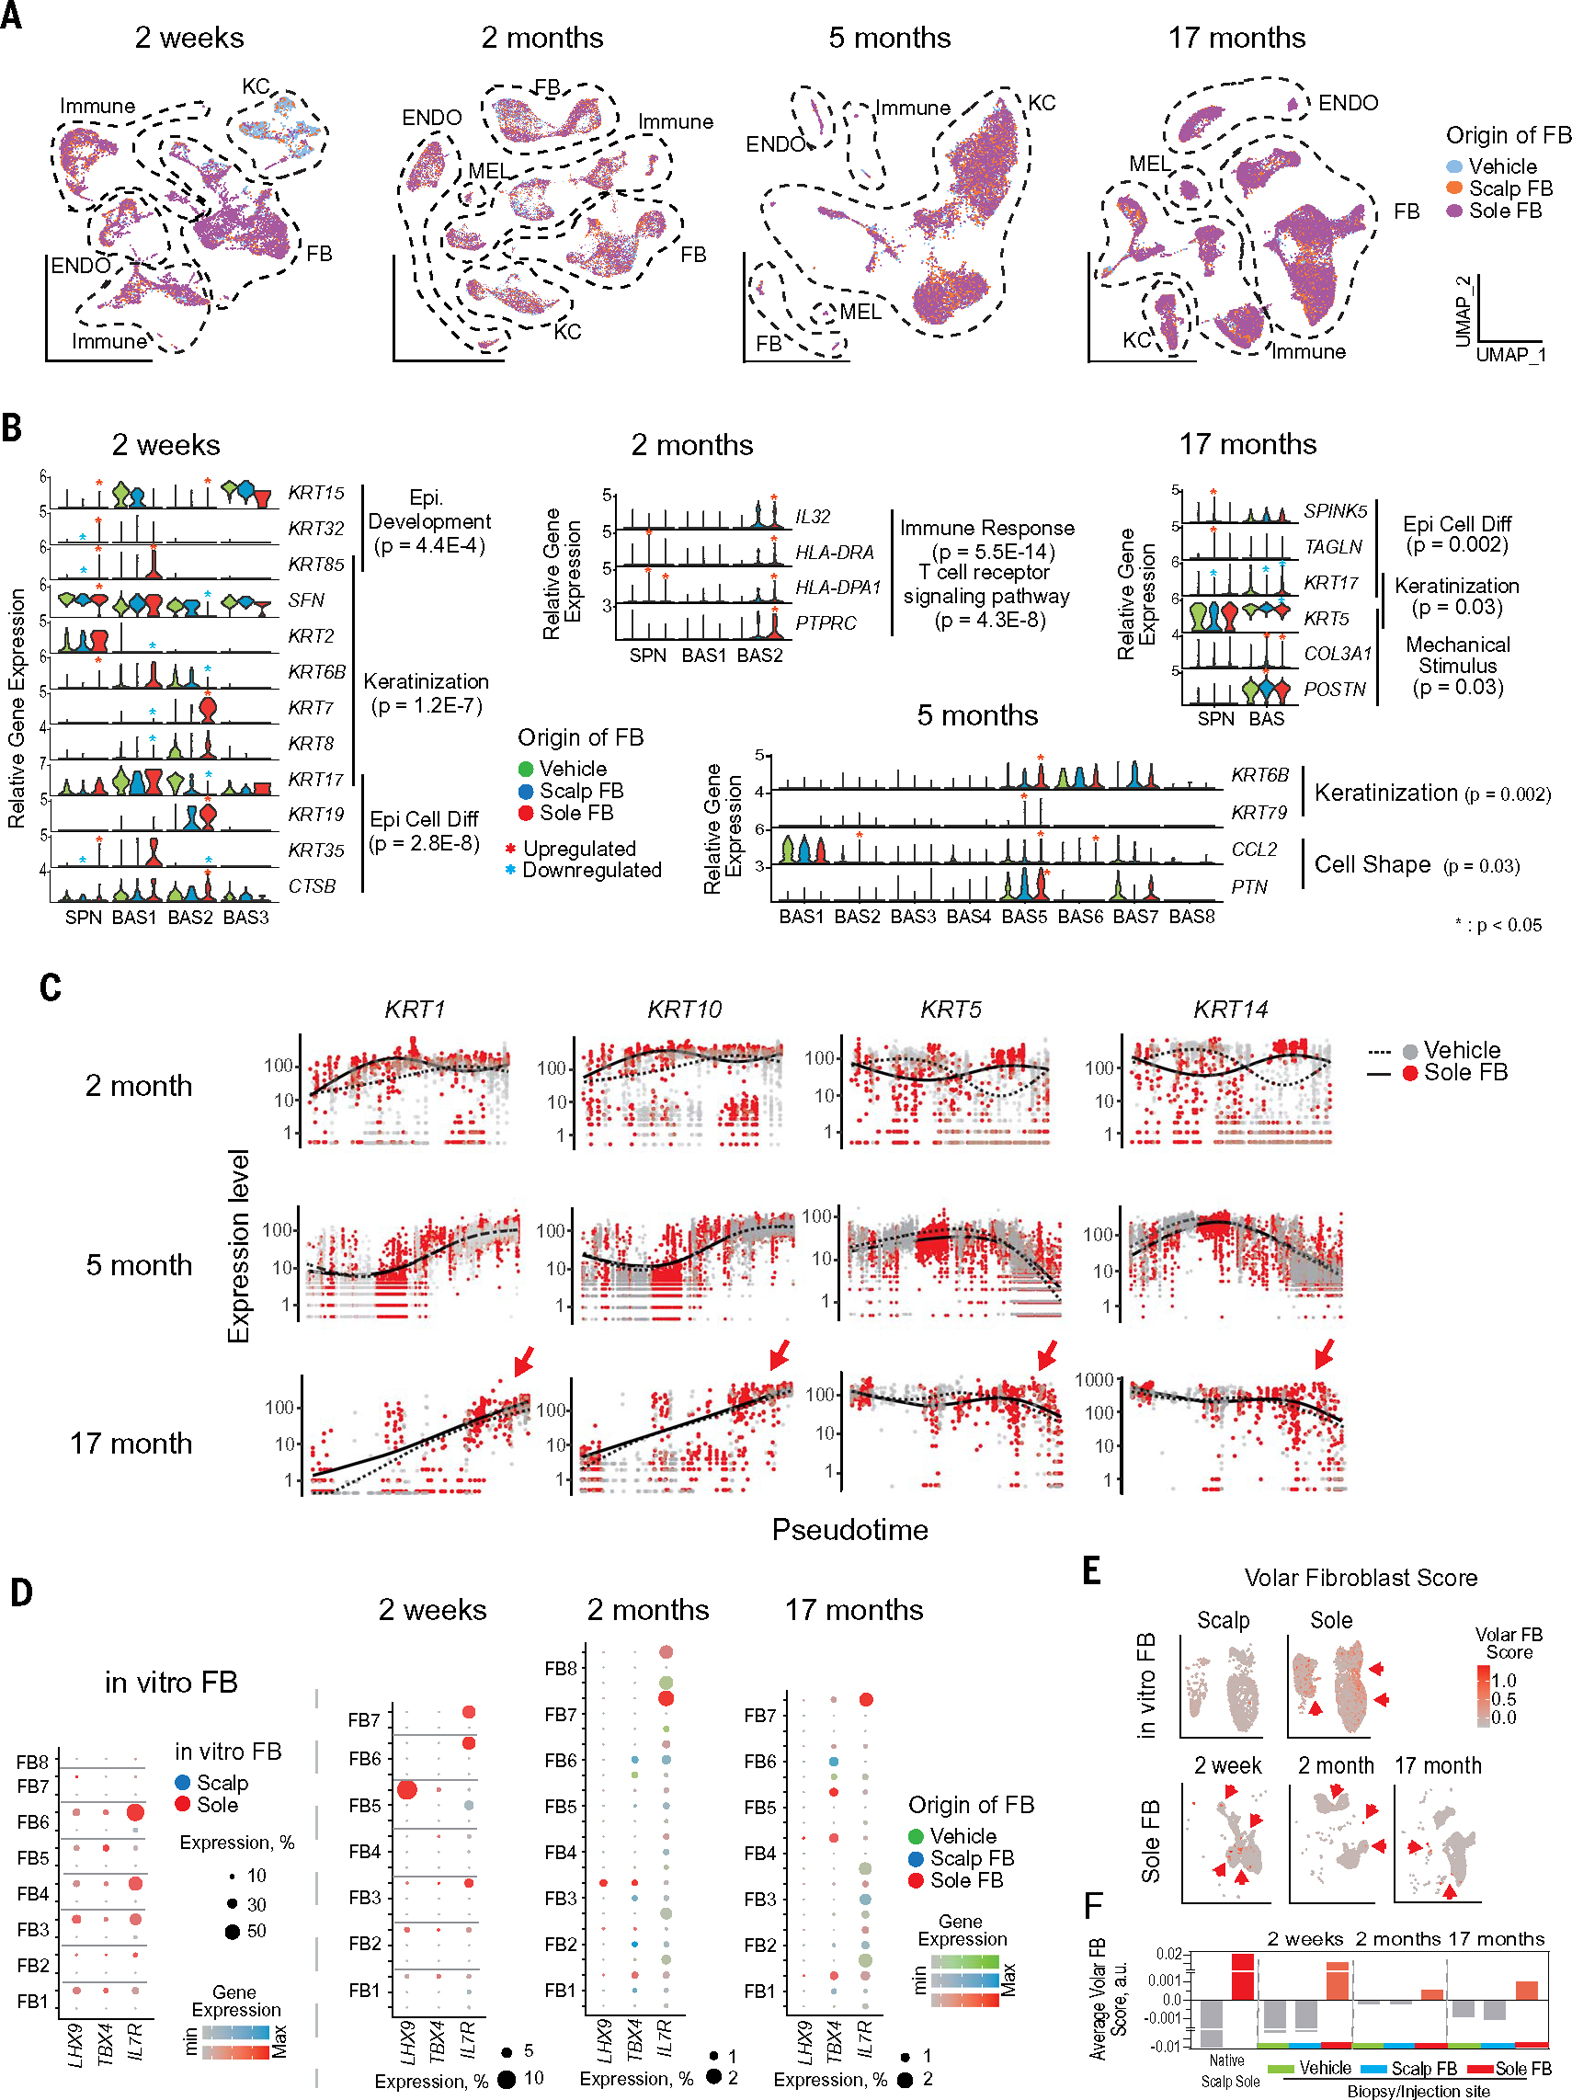
Fig. 3. scRNAseq of human skin after ectopic-cell injection demonstrates dynamic tissue changes.

(A) Scatter plots show UMAP cell clusters at 2-week, 2-month, 5-month, and 17-month postinjection time points. (B) Violin plots of relative gene expression from differentially expressed genes (DEG) in spinous (SPN) and basal (BAS) keratinocyte clusters from injected sites. Each violin plot represents DEG from 2-week, 2-month, 5-month, and 17-month time points. DEG with Padj < 0.05 were further analyzed by DAVID analysis and selected for presentation. (C) Keratinocyte pseudotime single-cell trajectories based on KRT1, 10, 5, and 14 gene expressions from Sole FB–injected sites (red; solid line) and Vehicle injected sites (gray; dotted line). KRT1/10 are expressed higher in the earlier pseudotimes, whereas KRT5/14 are expressed higher in later pseudotimes after sole fibroblast injection. (D) Dot plot of volar genes LHX9/TBX4/IL7R expressed in cultured native preinjection fibroblasts (left) versus fibroblast clusters from injected sites (right). LHX9/TBX4/IL7R are expressed in preinjection native sole fibroblasts but not scalp fibroblasts. These genes were also detected in the skin sites with volar fibroblast injection but decreased in abundance with time. (E) UMAP plots of volar fibroblast–specific gene expression score (LHX9/TBX4/IL7R) in native scalp and sole fibroblasts (top) and Sole FB–injected sites with various time points (bottom). Volar fibroblast scores were calculated using volar-specific genes in Fig. 3D. (F) Average volar fibroblast scores in fibroblast clusters from vehicle, Scalp FB, and Sole FB injection sites at different postinjection time points were calculated.
