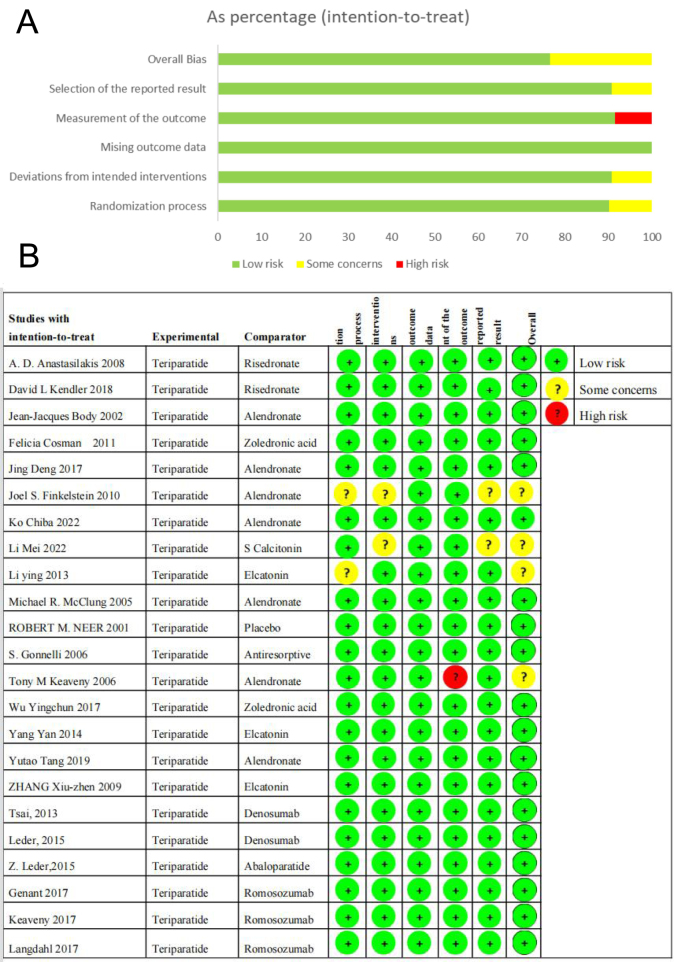
Figure 2.
(A) A proportional risk of bias graph is presented, showcasing the percentage of biased items from all the studies included in the analysis (20, 50, 51, 52, 53, 54, 55, 56, 57, 58, 59, 60, 61, 62, 63, 64, 65, 66, 67, 68, 69, 70, 71). This visual representation allows for a clear judgment of the level of bias present in the studies and provides insight into the overall reliability of the results. (B) Diagram Illustrating Risk of Bias: Evaluating Bias in Various Aspects Across Included Studies (20, 50, 51, 52, 53, 54, 55, 56, 57, 58, 59, 60, 61, 62, 63, 64, 65, 66, 67, 68, 69, 70, 71).

 This work is licensed under a