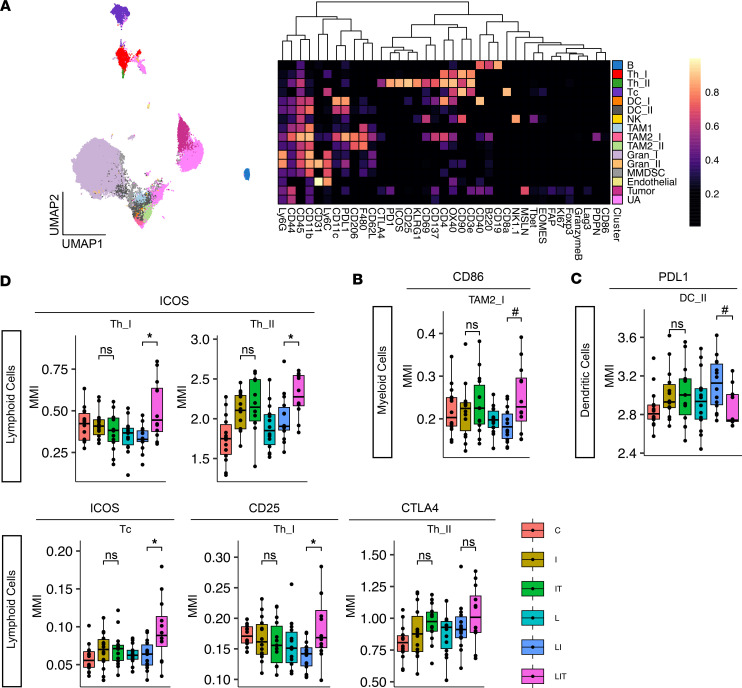
Figure 2. Deep profiling of myeloid, dendritic, and lymphoid cells by CyTOF in subcutaneous KPCY 6419c5 model.
(A) Uniform manifold approximation and projection (UMAP) and heatmap of final annotated clusters based on relative staining intensities of canonical subtyping markers. UMAP shows 2,000 cells per sample. B, B cell; Th, helper T cell; Tc, cytotoxic T cell; DC, dendritic cell; NK, natural killer cell; TAM, tumor-associated macrophage; Gran, granulocyte; MMDSC, monocytic myeloid-derived suppressor cell; UA, unassigned. (B–D) Boxplots showing mean metal intensity (MMI) of selected functional markers within selected clusters (n = 14). C, control; I, ICIs (anti–PD-1 & anti–CTLA-4); IT, ICIs + tadalafil; L, listeria vaccine; LI, listeria vaccine + ICIs; LIT, listeria vaccine + ICIs + tadalafil. For FDR-adjusted P values: *P ≤ 0.05, for unadjusted P values: #P ≤ 0.05, by 2-tailed Student’s t test between groups of interest.

