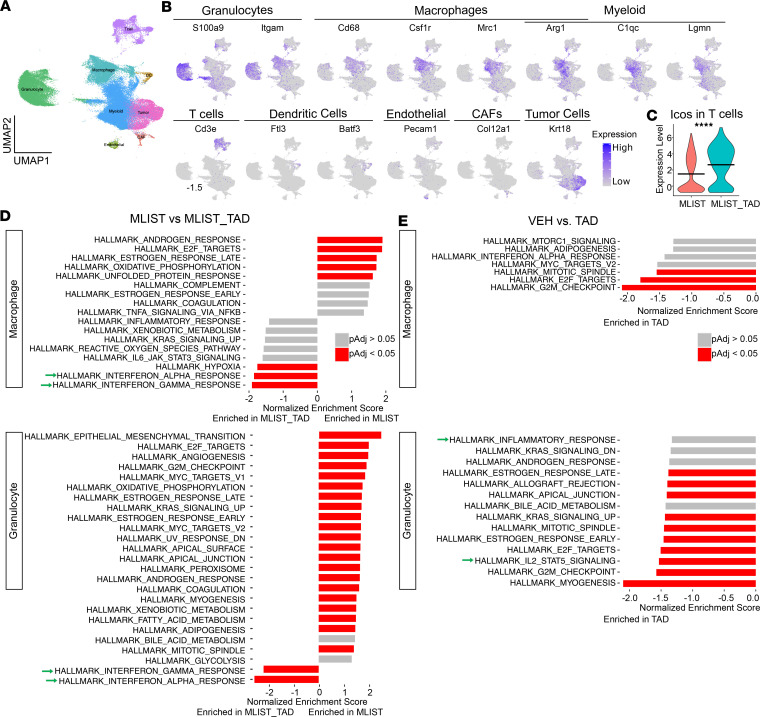
Figure 4. Pro-inflammatory pathways are enriched in macrophage and granulocyte clusters in tadalafil-treated groups.
(A) UMAP showing 80,543 cells. (B) Expression heatmaps showing genes used to annotate granulocyte, macrophage, and myeloid clusters (myeloid clusters); T cells; DCs; endothelial cells; CAFs; and tumor cells. (C) Violin plot showing differential expression of Icos in T cells at a per-cell level. (D and E) GSEA showing differentially enriched gene sets from the Hallmark database (n = 3). Green arrows are pointing to pathways of interest mentioned in the Results section. VEH, vehicle; TAD, tadalafil; MLIST, mesothelin listeria; MLIST_TAD, mesothelin listeria + tadalafil. ****P ≤ 0.0001 by Wilcoxon’s rank-sum test for C.

