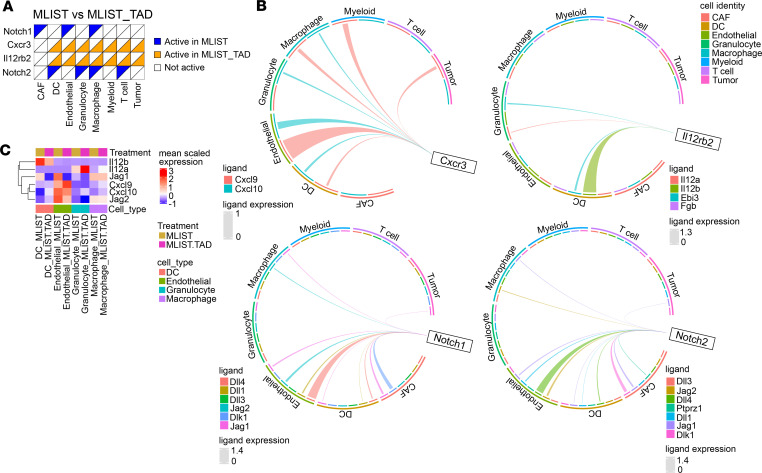
Figure 5. Inflammatory signaling axes are active in vaccine- and tadalafil-treated groups.
(A) Binary heatmap showing active receptors in cells by treatment group (n = 3). (B) Circos plots showing ligands of Cxcr3, Il12rb2, Notch1, and Notch2 and their cellular sources. Thickness of lines correlates to ligand expression levels; thicker lines correspond to higher expression. (C) Heatmap showing expression levels of selected ligands in DCs, endothelial cells, granulocytes, and macrophages.

