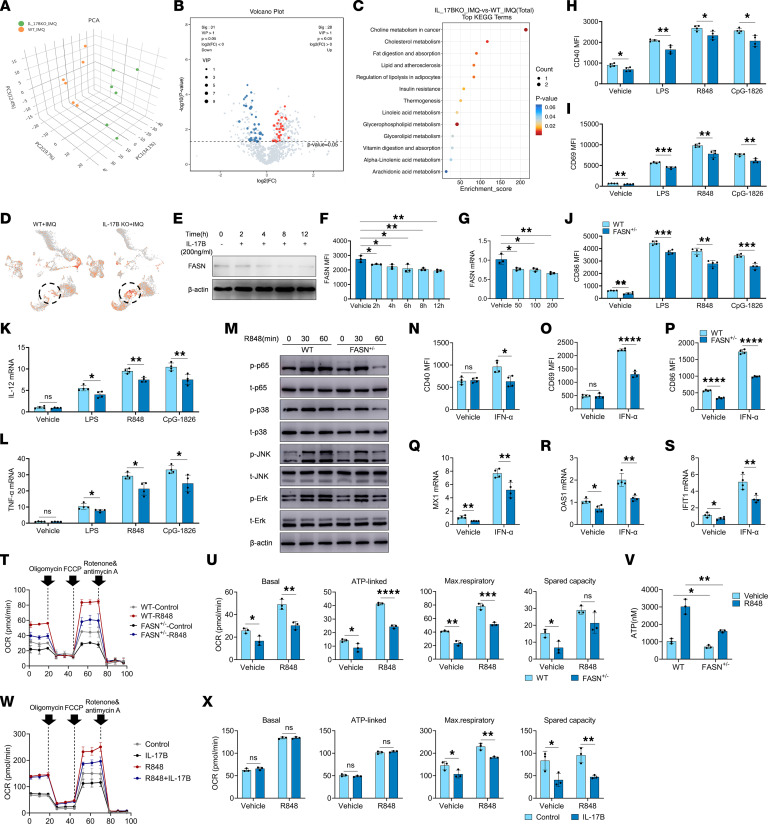
Figure 4. IL-17B suppresses the activation of B cells by attenuating the FASN/OXPHOS/ATP axis.
(A) PCA plot, (B) volcano plot, and (C) KEGG analysis of metabolites generated from serum lipid profiles of IMQ-treated WT (n = 6) and IL-17B–KO mice (n = 6). (D) The FASN intensity on each cell from IMQ-treated WT mice (n = 2) and IL-17B–KO mice (n = 2) was expressed as z score–normalized expression. Dashed-line circles indicate GC B cells. (E and F) Western blot and flow cytometry analysis of FASN expression in B cells after different time periods of rmIL-17B treatment. (G) Quantitative PCR analysis was performed to assess the expression of FASN in B cells following treatment with varying concentrations of rmIL-17B. (H–M) B cells, isolated from the spleen of WT mice or FASN+/– mice, were stimulated with LPS, R848, and CpG-1826. Expression of (H) CD40, (I) CD69, and (J) CD86 at 24 hours. mRNA levels of (K) IL-12 and (L) TNF-α at 6 hours. (M) Phosphorylation of p65, p38, JNK, and Erk. (N–S) B cells, isolated from the spleen of WT mice or FASN+/– mice, were stimulated with IFN-α. (N) CD40, (O) CD69, and (P) CD86 expression at 24 hours. (Q) MX1, (R) OAS1, and (S) IFIT1 mRNA levels at 6 hours. (T–V) B cells, isolated from the spleen of WT mice or FASN+/– mice, were stimulated with R848, and the (T and U) OCR was detected by seahorse, and the (V) ATP concentration was detected by ELISA. Murine splenic B cells were pretreated with rmIL-17B for 12 hours and stimulated with R848, and (W and X) OCR was detected. The data are shown as the mean ± SEM and are representative of 3 independent experiments. *P < 0.05, **P < 0.01, ***P < 0.001, ****P < 0.0001 by 1-way ANOVA with Tukey’s multiple-comparison test (F and G) or 2-tailed Student’s t test (H–L, N–S, U, V, and X). NS, P > 0.05.

