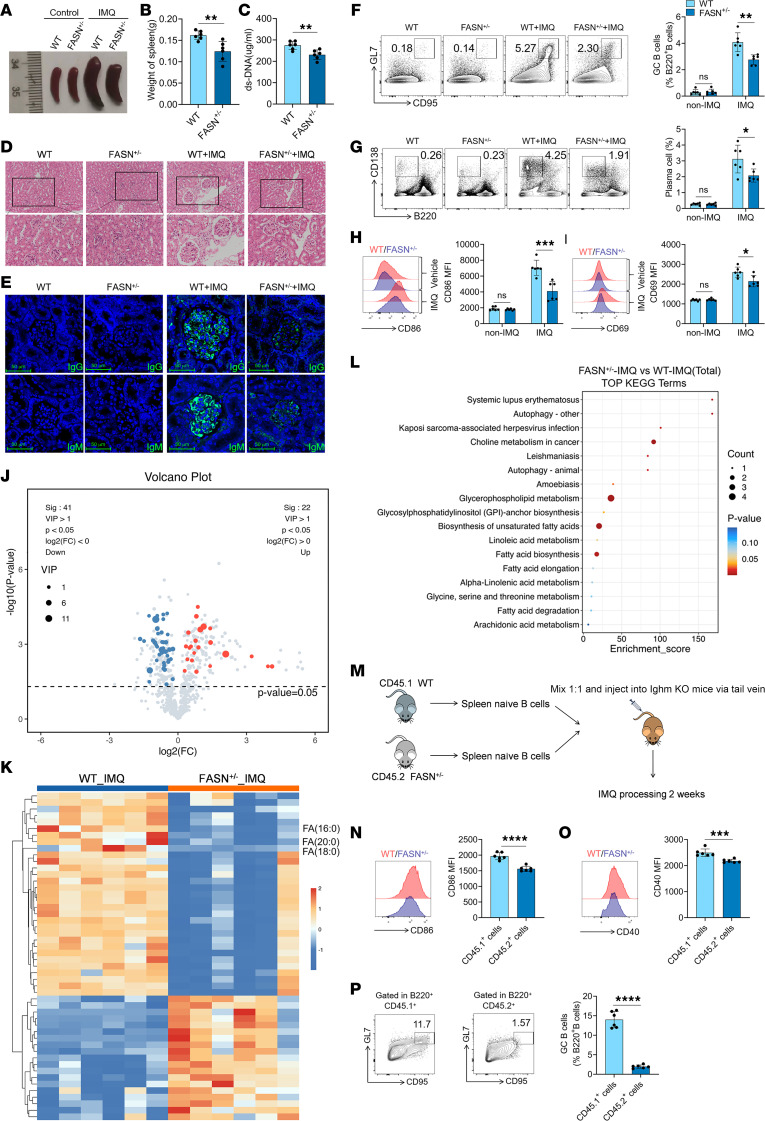
Figure 5. Repression of FASN mitigates IMQ-treated lupus in mice.
(A) Splenic images, (B) spleen weights, (C) serum levels of anti-dsDNA antibodies, (D) H&E staining of kidney, and (E) renal IgG and IgM deposition in WT or FASN+/– mice treated with IMQ. Scale bars: 100 μm. Representative flow cytometry images and statistical analysis of the percentages of (F) spleen GC B cells (B220+GL-7+CD95+), (G) plasma cells (CD138+B220–), and the expression of (H) CD86 and (I) CD69 on B220+ B cells in IMQ-treated WT or FASN+/– mice. (J) Volcano plot, (K) heatmap, and (L) KEGG pathway analysis based on spleen lipid profiles in IMQ-treated WT mice (n = 6) and FASN+/– mice (n = 6). (M) Schematic diagram of adoptive transfer. Expression of (N) CD86 and (O) CD40 on the surface of CD45.1+ B cells and CD45.2+ B cells in the spleen and the proportion of (P) spleen GC B cells (B220+GL-7+CD95+) in CD45.1+ B cells and CD45.2+ B cells. The data are shown as the mean ± SEM and are representative of 3 independent experiments (n = 6 mice/group). *P < 0.05, **P < 0.01, ***P < 0.001, ****P < 0.0001 by 2-tailed Student’s t test. NS, P > 0.05.

