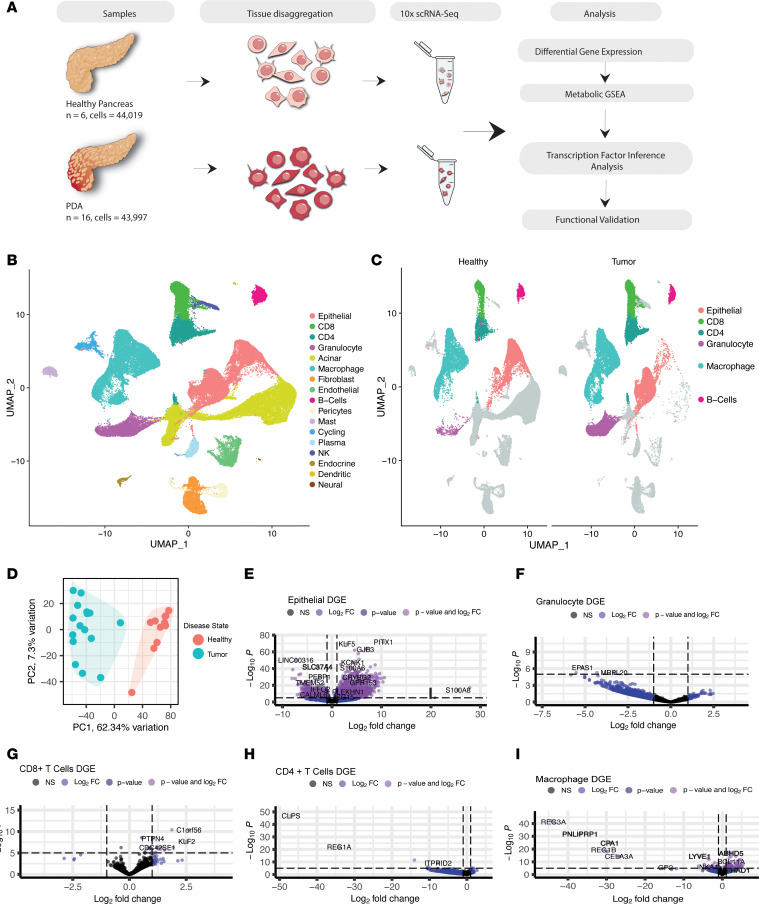
Figure 1. Data composition and workflow.
(A) Schematic of single-cell sequencing performed on 6 healthy pancreata procured from a collaboration with the Gift of Life Michigan, a center for organ and tissue procurement, and 16 pancreatic cancer samples: 10 from surgical resections and 6 from fine needle biopsies at the University of Michigan. Followed by analysis workflow. (B) Uniform manifold approximation and projection (UMAP) visualization of all identified cell types present in the pancreatic microenvironment. (C) UMAP visualization of cell types that demonstrated significant metabolic alterations in the pancreatic cancer samples compared with healthy human pancreas tissue when GSEA was performed with metabolic gene sets. (D) Principal component analysis (PCA) plot of healthy human pancreata samples and PDA samples. (E–I) Volcano plots of DGE by cell type. Genes that are significantly up- (top right) and downregulated (top left) in tumor versus heathy and the gene symbols are included for representative differentially expressed genes.

