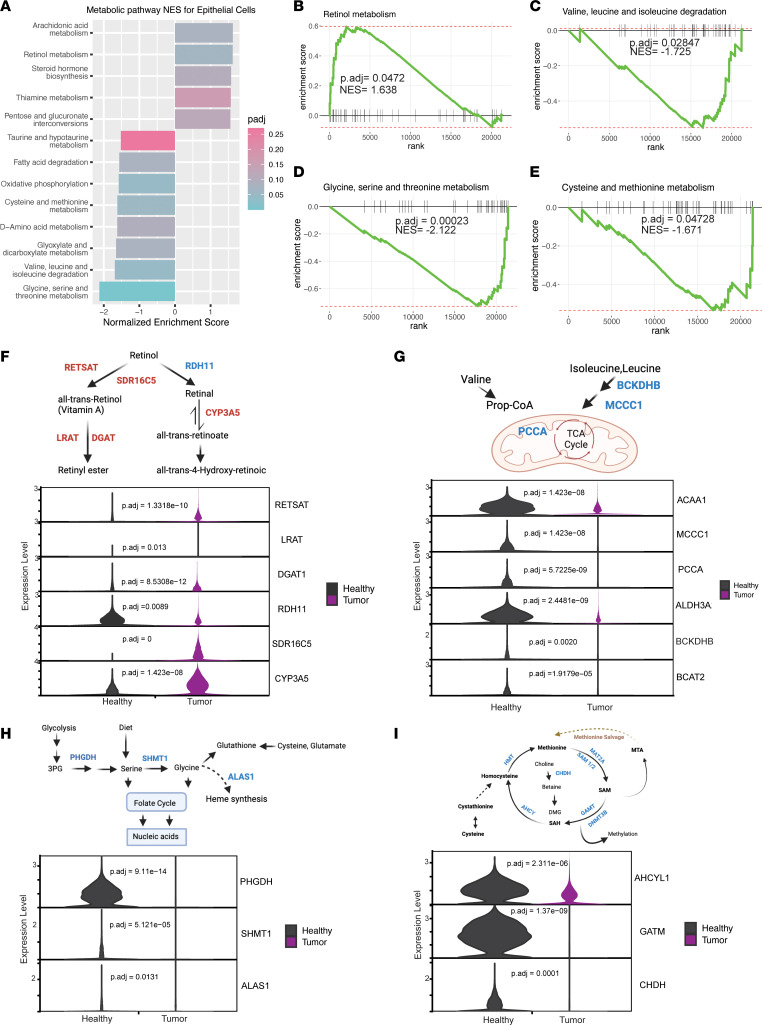
Figure 2. Metabolic coadaptations in pancreatic cancer cells.
(A) Significantly altered metabolic pathways in epithelial cells derived from pancreatic cancer samples (n = 16) compared with healthy pancreas samples (n = 6), with corresponding normalized enrichment scores (NES) and adjusted P values from GSEA. (B–E) GSEA enrichment plots of significantly up- or downregulated metabolic pathways in cancer cells with corresponding NES and adjusted P values. (F) Schematic of retinol metabolism, blue corresponding to differentially decreased genes and red to differentially increased in tumor-derived epithelial cells. Violin plots of selected retinol metabolism genes comparing healthy to tumor, with adjusted P values for significantly differentially expressed genes. (G) Schematic of valine, leucine, and isoleucine degradation. Violin plots of selected valine, leucine, and isoleucine metabolism genes comparing healthy with tumor, with adjusted P values for significantly differentially expressed genes. (H) Schematic of glycine, serine, and threonine metabolism. Violin plots of selected glycine, serine, and threonine metabolism genes comparing healthy with tumor, with adjusted P values for significantly differentially expressed genes. (I) Schematic of cysteine and methionine metabolism. Violin plots of cysteine and methionine metabolism genes comparing healthy with tumor, with adjusted P values for significantly differentially expressed genes.

