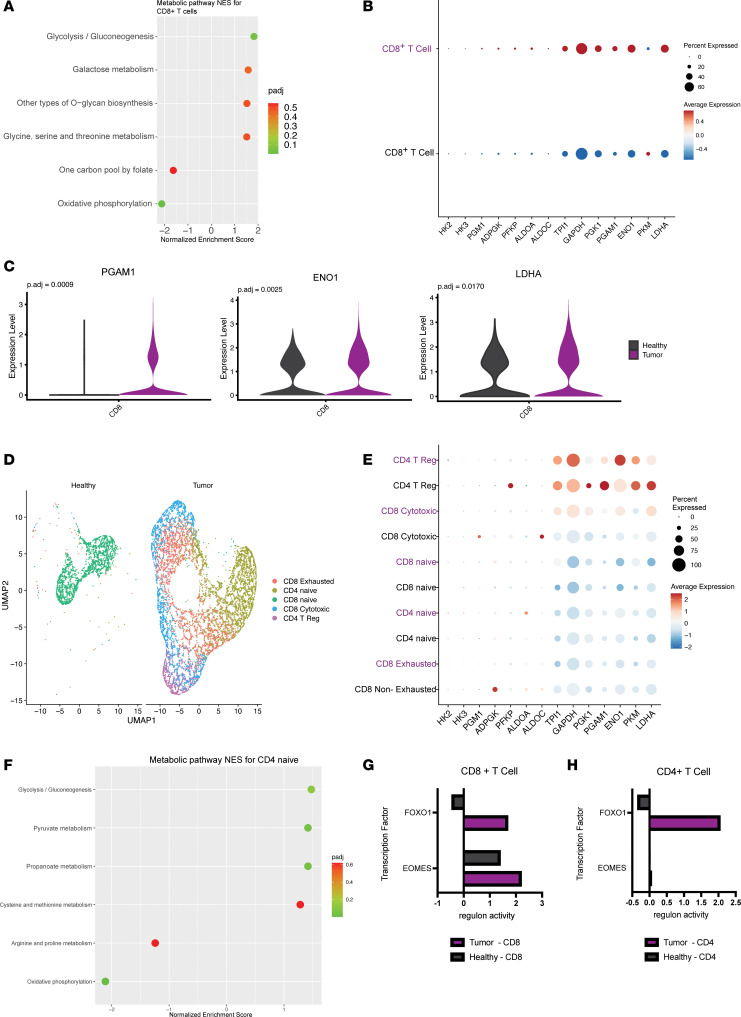
Figure 4. Metabolic rewiring of T cells in the pancreatic cancer microenvironment.
(A) Significantly altered pathways in CD8+ T cells from PDA samples compared with CD8+ T cells derived from the healthy tissue. (B) Dot plot visualization of the average expression and percentage of cells expressing genes driving glycolysis in CD8+ T cells from tumor tissue (purple) and healthy tissue (black). (C) Violin plots of the expression of selected differentially expressed glycolysis metabolism genes comparing CD8+ T cells from tumor samples with those from healthy samples. (D) UMAP visualization of CD4+ and CD8+ T cell populations in the tumor and healthy tissue. (E) Dot plot visualization of the average expression and percentage of cells expressing genes driving glycolysis in CD4+ and CD8+ T cell populations from tumor tissue (purple) and healthy tissue (black). (F) Significantly altered pathways in CD4+ naive cells from PDA samples compared with healthy naive CD4+ cells. (G and H) Transcription factor analysis showing regulon activity scores of FOXO1 and EOMES in CD8+ T cells in tumor and healthy samples.

