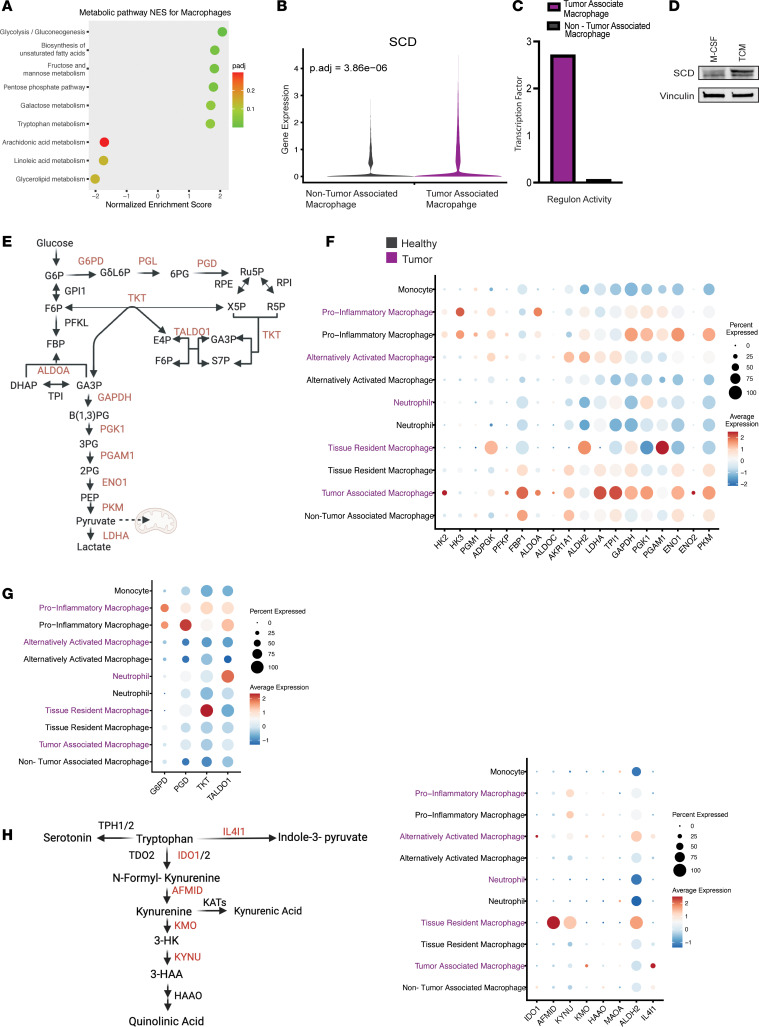
Figure 5. Metabolic alterations in TAMs.
(A) Significantly altered metabolic pathways in macrophages derived from pancreatic cancer samples compared with healthy pancreas samples, with corresponding NES and adjusted P values. (B) Violin plot of the expression of stearoyl-CoA desaturase (SCD) in macrophages in tumor and healthy samples, showing differential expression. (C) Transcription factor analysis showing regulon activity of PPARG in macrophages in tumor and healthy samples. (D) Western blot, where protein expression of SCD is higher in murine bone marrow–derived monocytes treated with TCM compared with control condition with M-CSF. (E) Glucose and PPP schematic. (F) Dot plot visualization of genes driving glycolysis displaying average expression and percentage expressed in macrophages in tumor (purple) and healthy pancreas tissue (black). (G) Dot plot visualization of genes driving PPP that do not overlap with glycolysis, displaying average expression and percentage expressed macrophages in tumor (purple) and healthy pancreas tissue (black). (H) Tryptophan metabolism schematic, with dot plot visualization of genes driving tryptophan metabolism, displaying average expression and percentage expressed in macrophages in tumor (purple) and healthy pancreas tissue (black).

