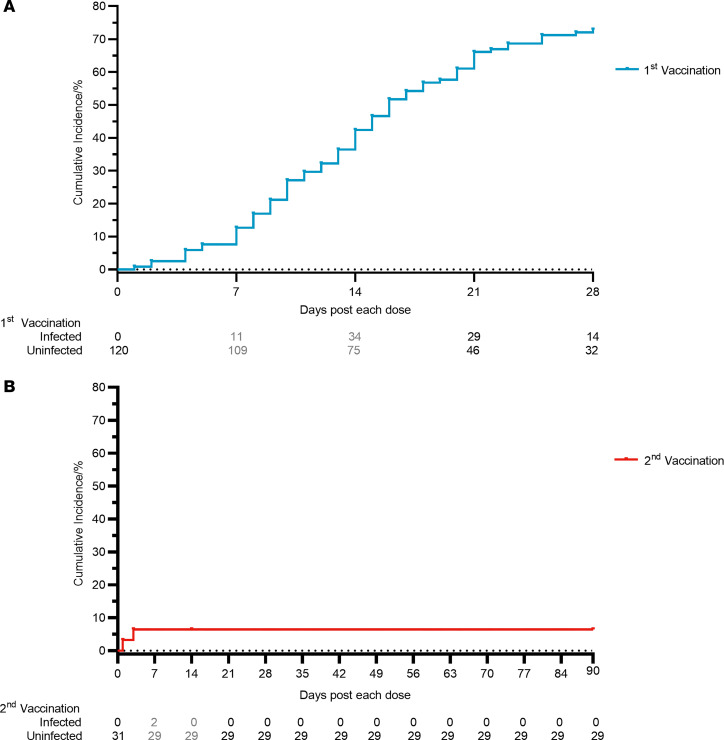
Figure 4. Time-to-infection curve for cumulative infection of SARS-CoV-2 Omicron BA.5 after intranasal vaccination.
(A) Time-to-infection curve for cumulative infection of SARS-CoV-2 Omicron BA.5 after the first dose. (B) Time-to-infection curve for cumulative infection of SARS-CoV-2 Omicron BA.5 after the second dose. The total number of participants and infected participants within a 7-day period was indicated at the end of each week.

