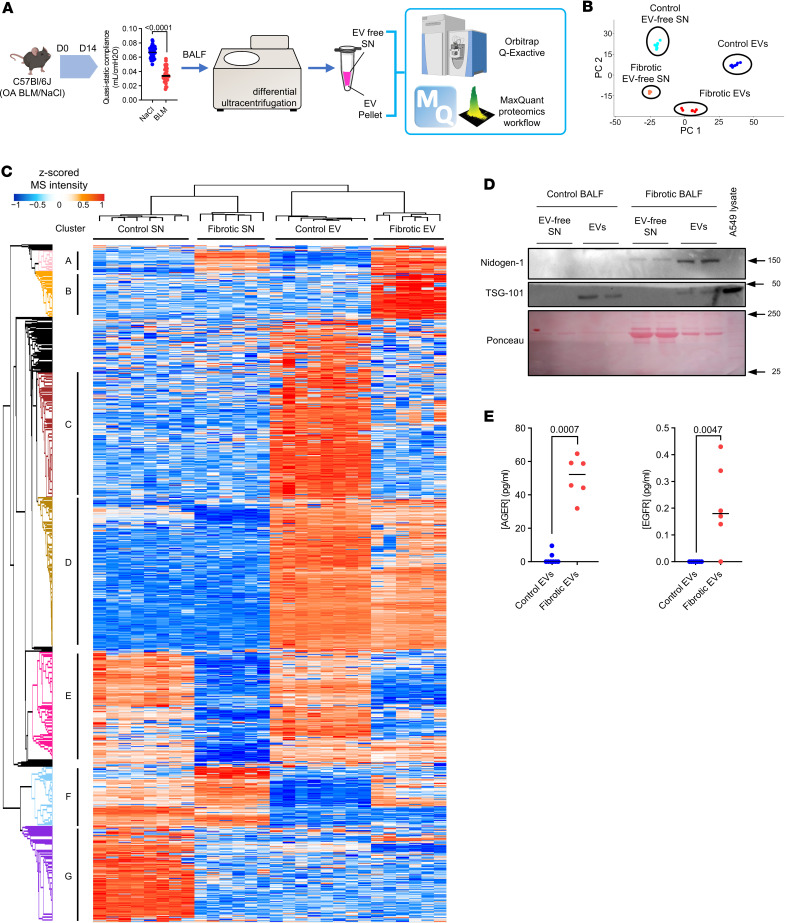
Figure 2. Label-free proteomics identifies several proteins specific to fibrotic EVs.
(A) C57BL/6J mice were exposed to orotracheal bleomycin or NaCl as control. At 14 days after injection, lung function was assessed and BALF was collected. BALF was utilized for EV isolation, and vesicular (EV pellet) as well as nonvesicular counterparts (EV-free SN) were subjected to label-free proteomics (n = 8 for control, n = 6 for bleomycin). (B) Principal component analysis representation of the different samples. (C) Heatmap of the identified proteins. Color coding corresponds to z-scored MS intensity values after imputation. Based on the unsupervised clustering, proteins were grouped into 7 clusters called A to G. (D) Levels of nidogen-1 (Western blot) in EVs from bleomycin or control mice are shown. TSG-101 was used to show protein enrichment in EVs, and protein content for each sample is shown with Ponceau. A549 lysate served as positive control. Equal (10 μg) protein content was used for the Western blot. (E) AGER and EGFR levels assessed by ELISA on normal (blue) and fibrotic (red) EVs. Data are presented as analyte concentration (pg/mL) normalized to 2 × 10⁸ vesicles. Statistical analysis by nonparametric Mann-Whitney. SN, EV-free fraction.

