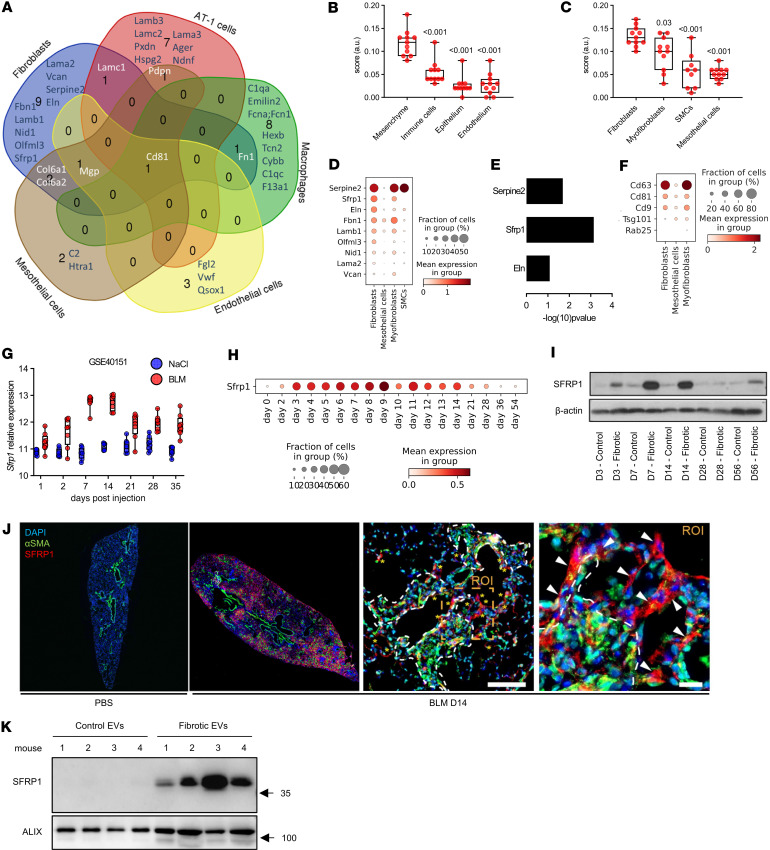
Figure 3. Fibroblasts are a major source of EVs during fibrosis.
(A) Venn diagram depicting the cellular origin of the bleomycin BALF-EV proteins. (B and C) Scoring of an scRNA-Seq dataset (GSE141259) for the mean expression of the 107 proteins identified in the bleomycin BALF-EVs in the main cellular compartments of the lung (B) as well as in mesenchymal populations (C). Box plots show the interquartile range, median (line), and minimum and maximum (whiskers). SMCs, smooth muscle cells. (D) Top proteins expressed in fibroblasts, among the proteins identified in bleomycin-BALF-EV and classified in main mesenchymal cellular compartments. (E) Statistical difference in the proteomic dataset between fibrotic and control EVs for the top 3 most expressed fibroblast-related genes. (F) Analysis of an scRNA-Seq dataset (GSE40151) for the expression of EV machinery in fibroblasts expressing (true) or not expressing (false) Sfrp1. (G) Gene expression of Sfrp1 in the lungs of mice with bleomycin-induced lung fibrosis or control (NaCl) mice. Data from GSE40151. (H and I) Expression of SFRP1 in lung tissue from mice exposed to bleomycin at different time points at the transcriptomic (H, data from GSE141259) or proteomic level (I). (J) Immunofluorescence staining for α-SMA (green) and SFRP1 (red) in FFPE lung sections from mice challenged with bleomycin (day 14) or NaCl as control. Representative observation of a fibrotic area from a mouse lung 14 days after bleomycin (right panels). Asterisks denote SFRP1+ transitional fibroblasts, dashed lines indicate fibrotic dense areas with α-SMA+ myofibroblasts (in green), and arrowheads point out single SFRP1+ transitional fibroblasts (in red) in the zoomed ROI. Nuclei are stained with DAPI (blue). Scale bars = 100 μm or 20 μm (ROI’s zoom). (K) Western blot for SFRP1 expression on normal and fibrotic EVs (n = 4/group). Equal number of vesicles (2 × 10⁸) loaded. ALIX serves as EV-enriched protein. Molecular weights (kDa) are indicated. All statistical analyses by nonparametric Mann-Whitney. P values as indicated.

