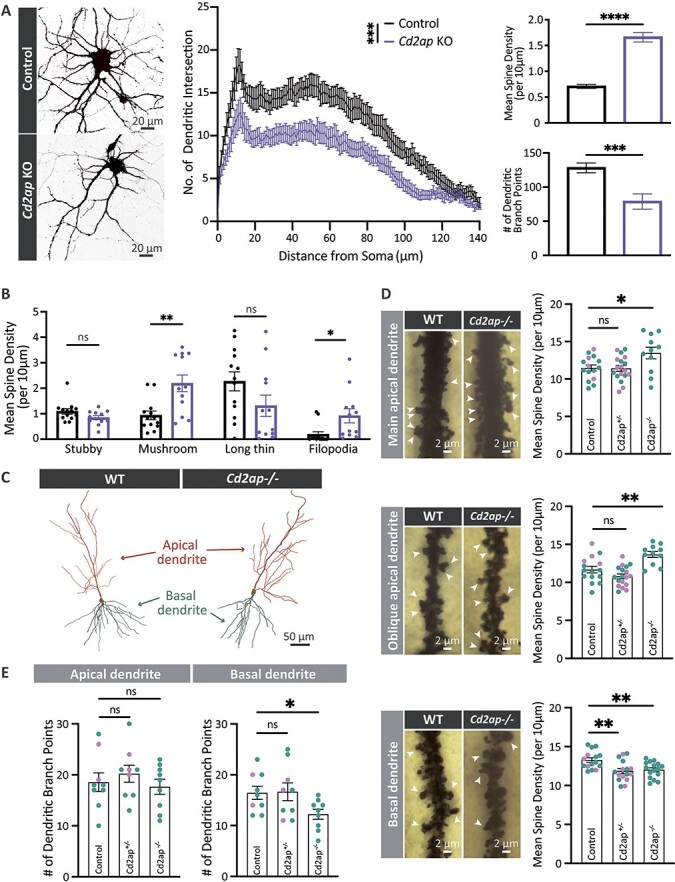
Figure 3.

Loss of Cd2ap disrupts neuronal and synaptic morphology. (A) CRISPR-mediated knockout (KO) of Cd2ap in mouse primary Cas9 neurons results in increased dendritic spine density and fewer dendritic branch points at DIV21. Control Cas9 neurons were transfected with control AAV expressing guide sequences targeting LacZ. Statistical analysis of dendritic spines and branchpoints was based on t-tests, with sample size (N) = 20 and 19 cells for Cd2ap controls, respectively. Cd2ap KO primary neurons also show a decrease in the number of dendritic intersections based on Sholl analysis, based on statistical analysis using linear mixed-effects models with N = 18 or 15 cells for Cd2ap and controls, respectively. ns, non-significant; ***P < 0.001; ****P < 0.0001. All error bars denote mean ± SEM. (B) Cd2ap KO neurons show increased density of mushroom spines and filopodia, but unchanged stubby or long thin spines, based on t-tests. Density calculated as number of spines per 10 μm of dendrite. N = 12 and 13 cells for Cd2ap or control, respectively. ns, non-significant; *P < 0.05; **P < 0.01. All error bars denote mean ± SEM. (C) Representative CA1 hippocampal pyramidal neuron traces showing the analyzed apical and basal dendritic trees of 5–6-weeks-old wildtype control (WT) and Cd2ap−/− mice. (D) Cd2ap−/− mice have increased spine density on both main and oblique apical dendrites. Arrowheads indicate representative spines. By contrast, basal dendrites show decreased spine density in both Cd2ap−/− and Cd2ap+/− mice. Statistical analysis was based on t-tests. For apical dendrites, samples sizes (number cells quantified) were WT = 15 (4F and 11M); Cd2ap+/− = 18 (10F and 8M); and Cd2ap−/− = 11 (11M). For basal dendrites samples sizes were WT = 15 (4F and 11M); Cd2ap+/− = 16 (8F and 8M); and Cd2ap−/− = 16 (16M). Cells were counted from at least 2 independent animals per genotype. ns, non-significant; *P < 0.05; **P < 0.01. All error bars denote mean ± SEM. See also Fig. S6 for results of Sholl analyses. (E) Dendritic branching of basal but not apical dendrites is decreased in Cd2ap−/− mice. No change was observed in Cd2ap+/− heterozygotes for either apical or basal dendrites. Statistical analysis was based on t-tests, with N = 9 cells for each group. Sex distribution of the cells’ animals of origin was as follows: WT had 2F and 7M cells; Cd2ap+/− had 3F and 6M cells; and Cd2ap−/− had all M cells. ns, non-significant; *P < 0.05. All error bars denote mean ± SEM. The color of individual data points in panel (D) and (E) bar graphs indicates the sex of the animal of origin for each cell, with teal indicating male mice and lavender indicating female mice. Samples sizes (number of mice) used for analyses in (D) and (E) were WT = 4 (1F and 3M); Cd2ap+/− = 4 (2F and 2M); and Cd2ap−/− = 2 (2M). Given the unequal distribution of males and females in the control versus Cd2ap−/− groups in (D) and (E) we cannot exclude sex effects as a potential source of variability. See also Fig. S13 panels A-B for the animal of origin distribution for all cells analyzed in D and E and a display of potential effects of animal-dependent variability.
