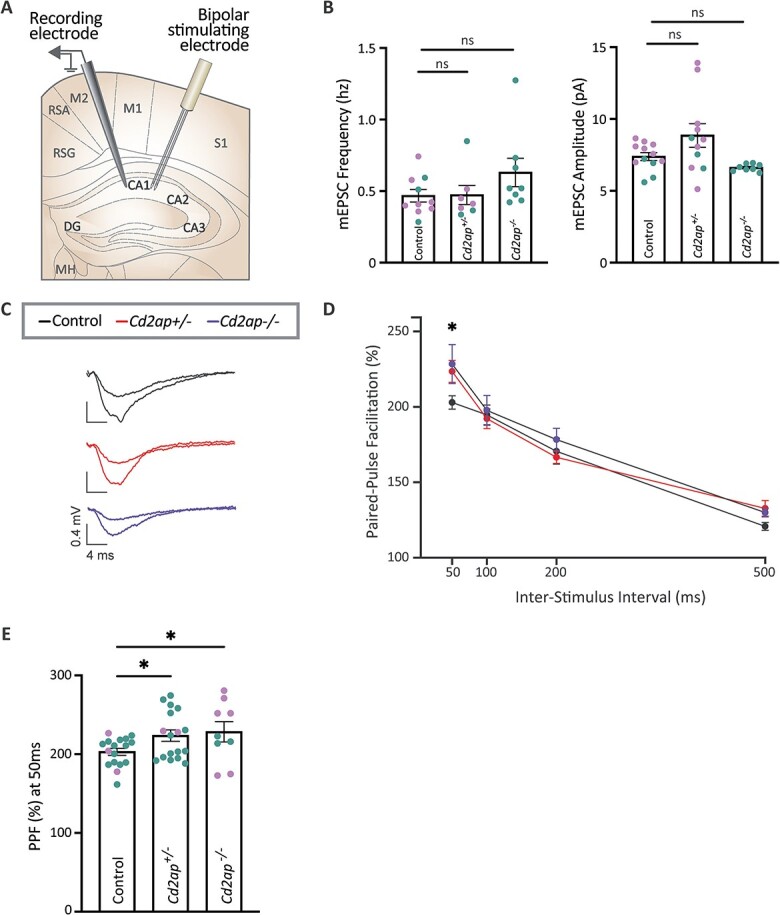
Figure 4.

Cd2ap is required for short-term hippocampal plasticity. (A) Graphical representation of the setup for recording from Schaffer collaterals of the hippocampal CA1 region. (B) mEPSC frequency and amplitude are not significantly changed in Cd2ap homozygous or heterozygous animals (P > 0.05; ns, non-significant), when compared with wildtype controls (WT). All electrophysiological recordings were performed in acute coronal brain slices from 5 to 8-week old animals (mean 6.7 weeks). Statistical analysis was performed using one-way ANOVA with Dunnett’s post-hoc test. For analysis of mEPSC frequency, sample sizes (N cells recorded) were as follows: WT = 10 (7 female and 3 male); Cd2ap+/− = 7 (4F and 3M); and Cd2ap−/− = 8 (8M). For analysis of mEPSC amplitude, sample sizes were as follows: WT = 12 (8F and 4M); Cd2ap+/− = 11 (8F and 3M); and Cd2ap−/− = 8 (8M). Samples sizes (number of mice) were WT = 7 (4F and 3M); Cd2ap+/− = 5 (3F and 2M); and Cd2ap−/− = 4 (4M). All error bars denote mean ± SEM. See also Fig. S7 for additional neurophysiology examining basal membrane properties. (C) Representative traces from paired pulse facilitation (PPF) trials, recorded from the hippocampal CA1 Schaffer collaterals in WT, Cd2ap+/−, and Cd2ap−/− animals. The top trace recorded from each genotype is the excitatory post-synaptic potential (EPSP) response to the first PPF pulse, and the bottom, larger trace is the EPSP response to the second pulse. To obtain PPF, the slope (mV/ms) of the rising phase at the initial segment of each response is measured and PPF is calculated as the ratio of EPSP slopes (second pulse/first pulse). (D) PPF is increased in both Cd2ap homozygous and heterozygous animals, when compared with WT controls for the 50 ms inter-stimulus interval (ISI) trial. Statistical analysis was performed using two-way ANOVA with Holm-Šídák’s post-hoc test, with sample sizes (slices recorded): WT = 17 (3F and 14M); Cd2ap+/− = 17 (2F and 15M); and Cd2ap−/− = 9 (6F and 3M). Samples sizes (number of mice) were WT = 10 (1F and 9M); Cd2ap+/− = 9 (1F and 8M); and Cd2ap−/− = 5 (2F and 3M). *P < 0.05. All error bars denote mean ± SEM. (E) Bar graph shows increase in PPF in Cd2ap homozygous and heterozygous animals at 50 ms ISI. Teal data points are from recording on slices from male mice and lavender data points are from recording on slices from female mice. *P < 0.05. All error bars denote mean ± SEM. The color of individual data points in panel (B) and (E) bar graphs indicates the sex of the animal of origin for each cell, with teal indicating male mice and lavender indicating female mice. Given the unequal distribution of males and females in the control versus Cd2ap−/− groups in (B) and (E) we cannot exclude sex effects as a potential source of variability. See also Fig. S13 panels C-D for the animal of origin distribution for all cells/slices analyzed in (B) and (E) and a display of potential effects of animal-dependent variability.
