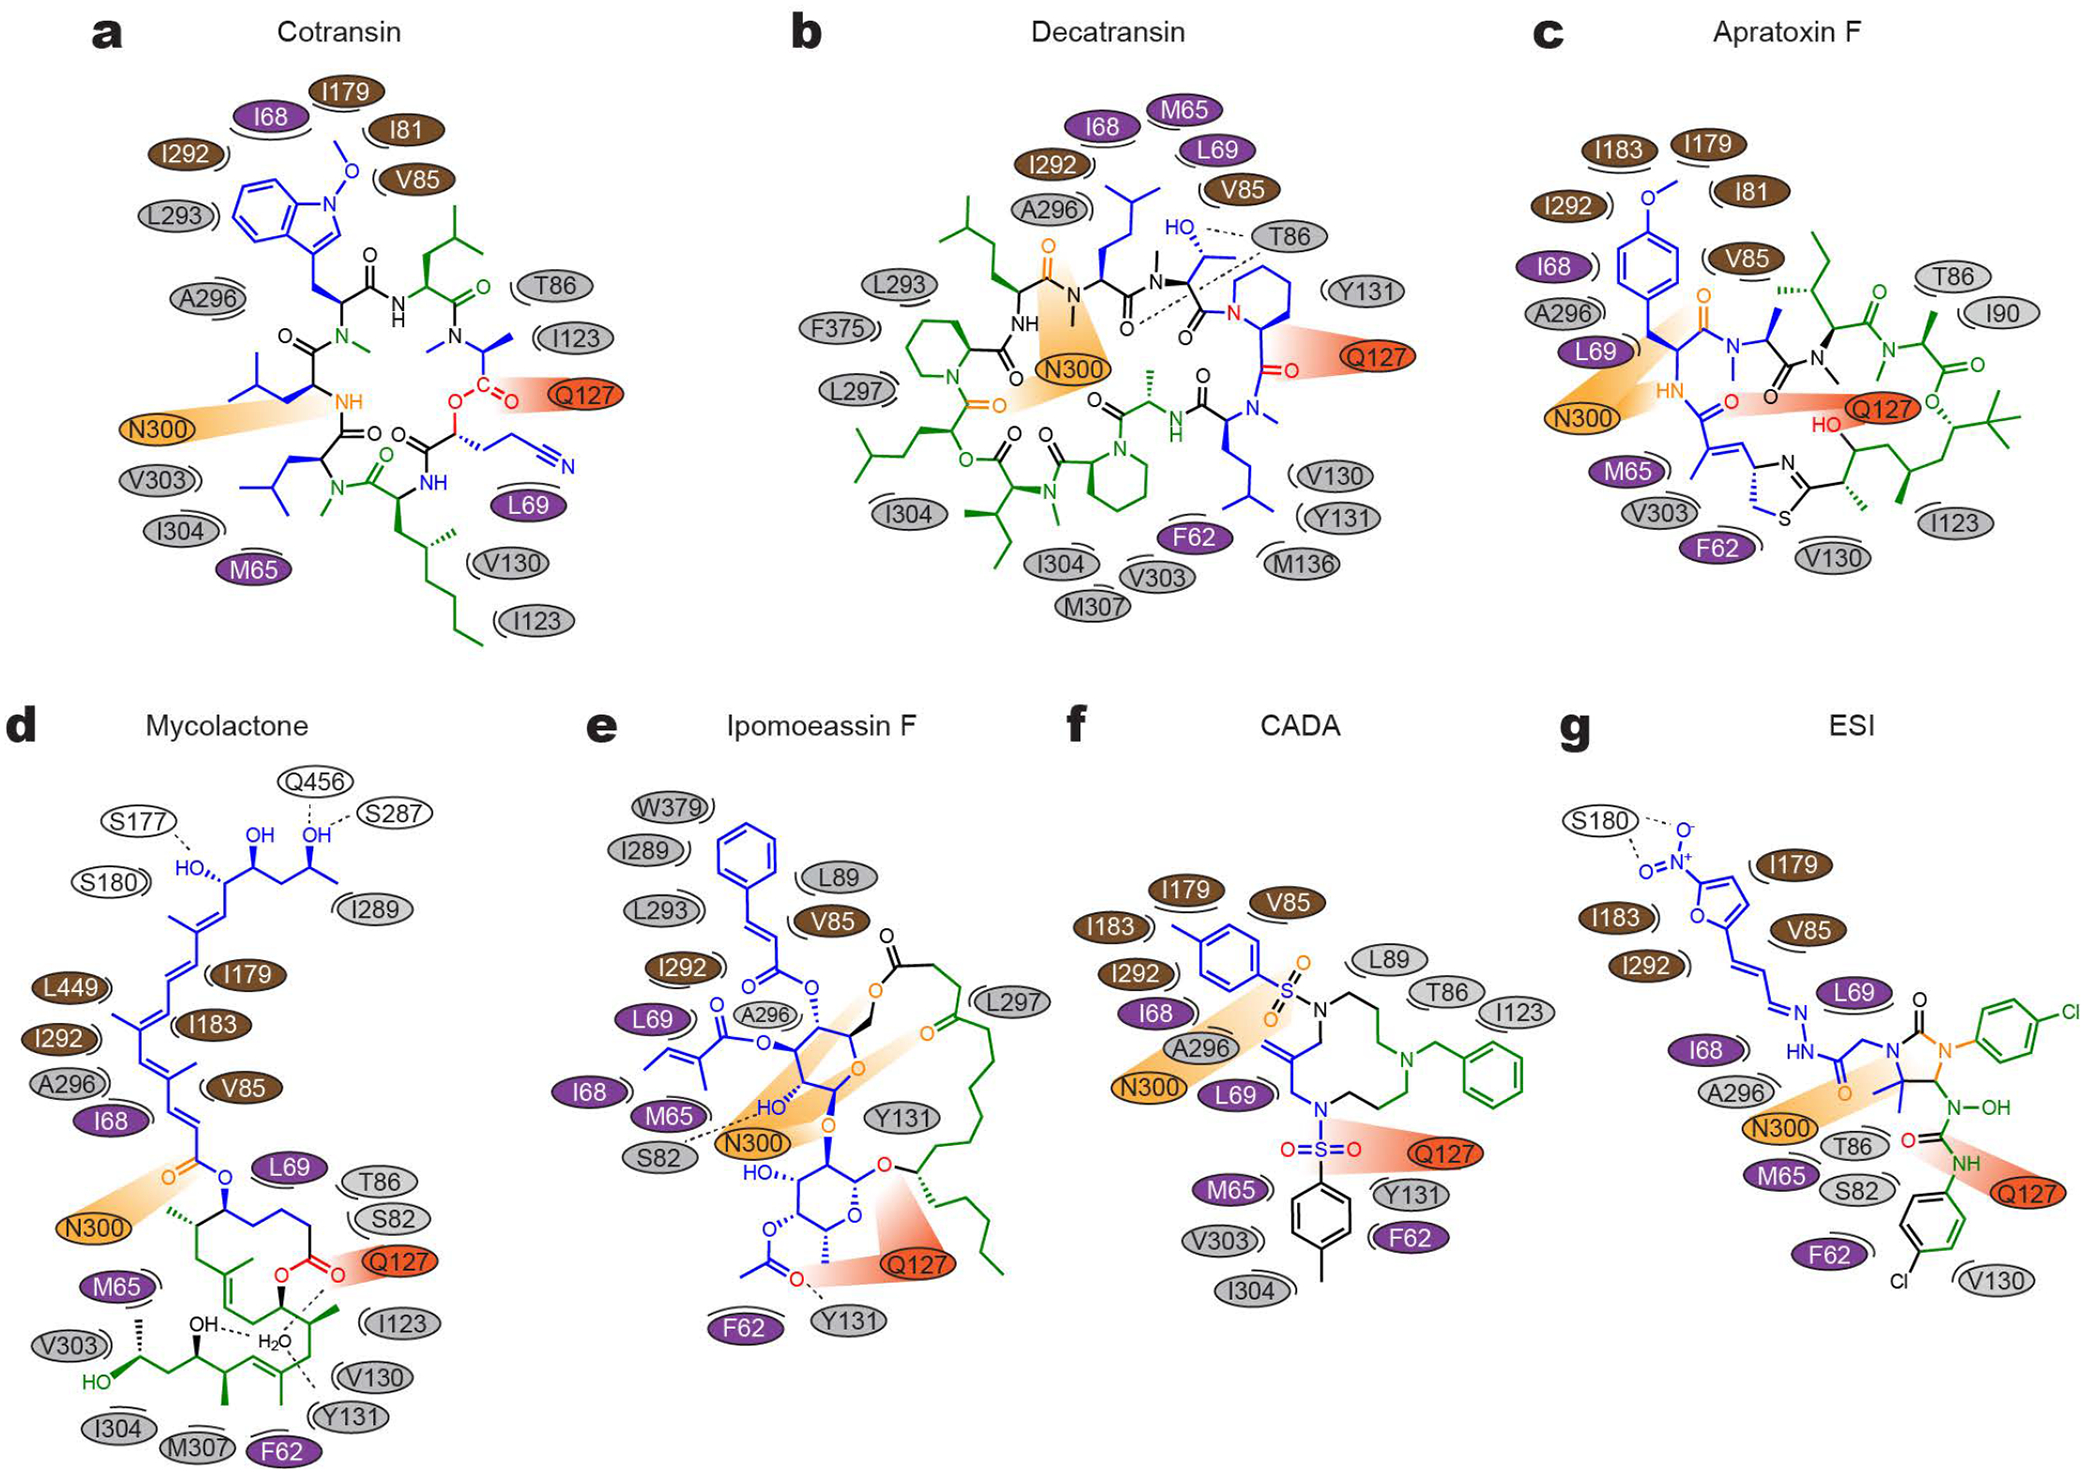
Figure 3. Maps for interactions between Sec61 and inhibitors.

a, The chemical structure of cotransin CP2 and the positions of amino acids (ovals) of Sec61 in the immediate vicinity are drawn in a two-dimensional representation. Different colors were used for ovals to indicate regions in Sec61α: purple–plug, brown–pore ring, gray–lateral gate, light and dark oranges–polar cluster Q127/N300, and white–others. In the cotransin CP2 chemical structure, main lipid-exposed parts are in green whereas channel-facing parts are in blue. Moieties in orange and red interact with N300 and Q127 respectively. b–g, As in a, but drawn for decatransin (b), apratoxin F (c), mycolactone (d), ipomoeassin F (e), CADA (f), and ESI (g). Dashed lines indicate putative hydrogen bonds. Note that in the mycolactone-bound structure, a water molecule coordinated by Sec61 and mycolactone was observed in the pocket. For 3D structures, see Extended Data Fig. 8.
